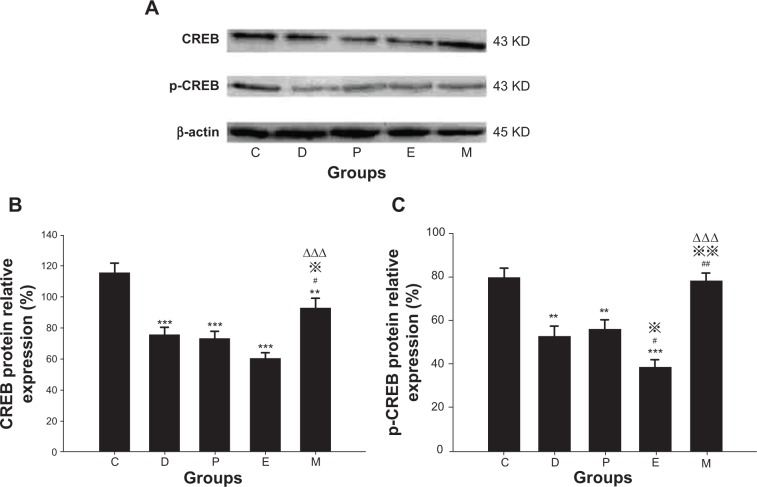
Figure 7.
Hippocampal CREB/p-CREB protein expression in rats after ECS (or MECS) treatment.
Notes: Western blot bands of CREB/p-CREB and β-actin (A); relative expression of CREB protein (B); relative expression of p-CREB protein (C). Data are presented as the mean ± SE; **P<0.01, ***P<0.001 versus group C; #P<0.05, ##P<0.01 versus group D; P<0.05, P<0.01 versus group P; ΔΔΔP<0.001 versus group E. C represents control rats; D represents CUMS-pretreated rats that received sham ECS with normal saline pretreatment; P represents CUMS-pretreated rats that received sham ECS with propofol pretreatment; E represents CUMS-pretreated rats that received ECS with normal saline pretreatment; M represents CUMS-pretreated rats that received ECS with propofol pretreatment; n=5–6 in each group.
Abbreviations: CUMS, chronic unpredictable mild stresses; ECS, electroconvulsive shock; MECS, modified ECS; SE, standard error.

