
Figure 6.
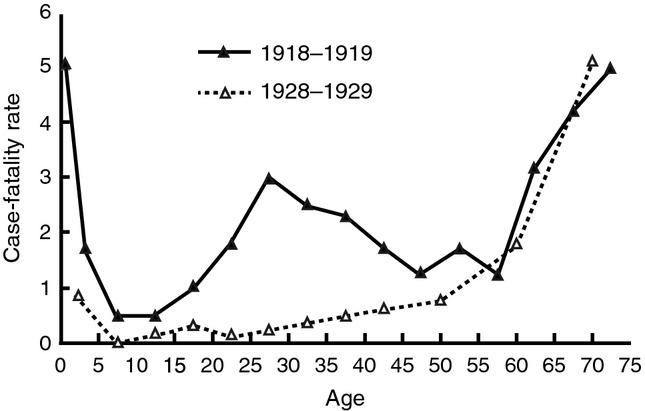
Case-fatality per 100 persons ill with influenza and pneumonia per age group in 1918 (U.S. Public Health Service house-to-house surveys, 8 states) and 1928–1929 (U.S. Public Health Service surveys). The unique W-shaped curve illustrates the high case-fatality rate among infants, young adults, and elderly in 1918 (published in reference 35; publication in the public domain).