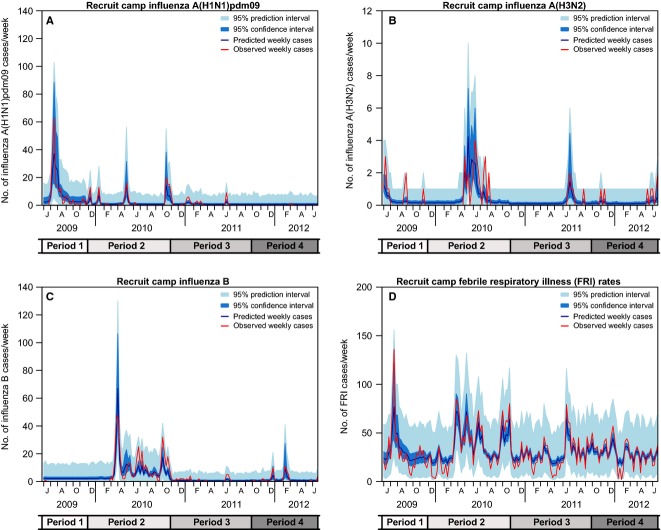
Figure 2.
Comparison of Recruit Camp Influenza Cases (A, B, C) and Febrile Respiratory Illness (FRI) Cases (D) with Predictions from the Ecological Time Series Model. Lines represent observations (red) and predictions (blue). Shaded regions are 95% confidence intervals (dark blue) and prediction intervals (light blue). The y-axis scales differ for B and D.

