Figure 2.

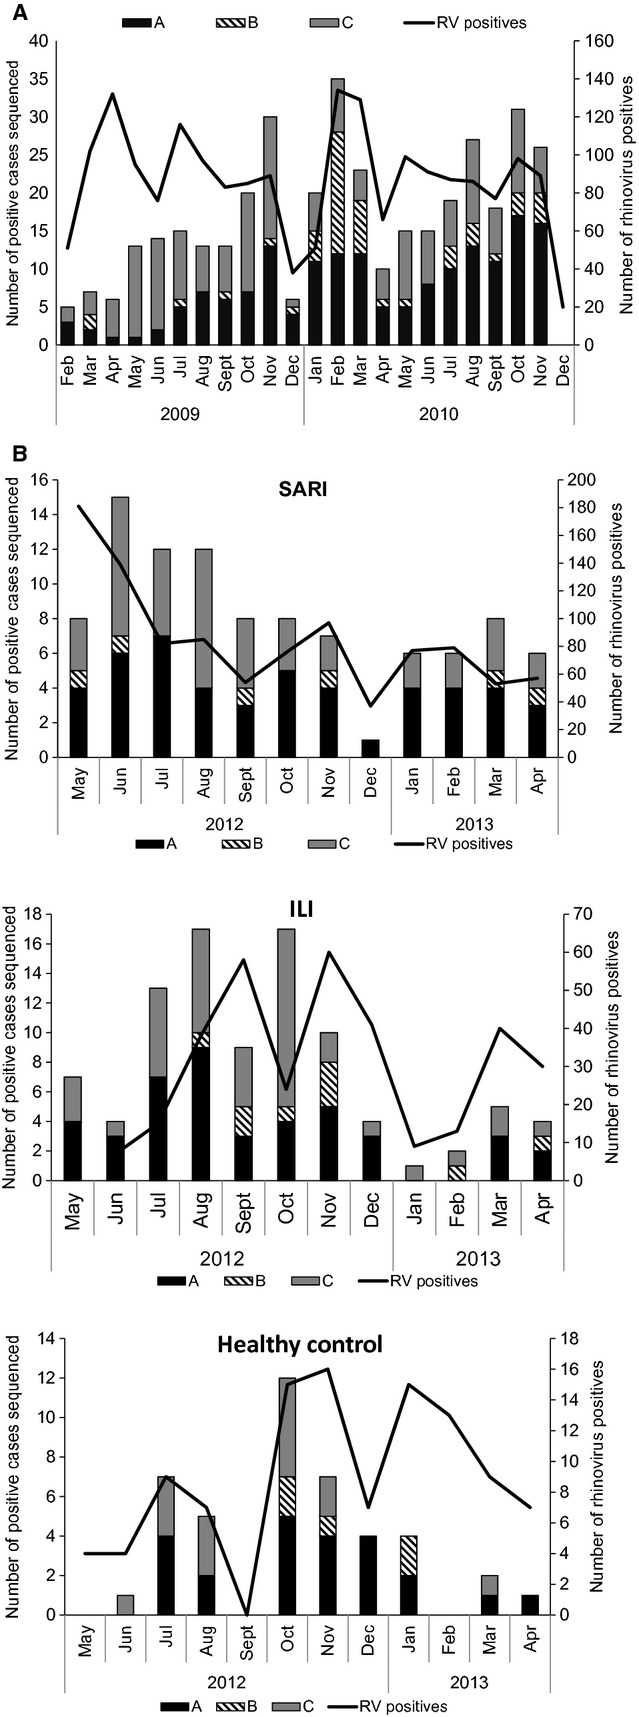
Number of positive cases and detection rate of Rhinovirus by month in South Africa, 2009–2010 SARI (A) and 2012–2013 SARI, ILI and control cases (B).

Number of positive cases and detection rate of Rhinovirus by month in South Africa, 2009–2010 SARI (A) and 2012–2013 SARI, ILI and control cases (B).