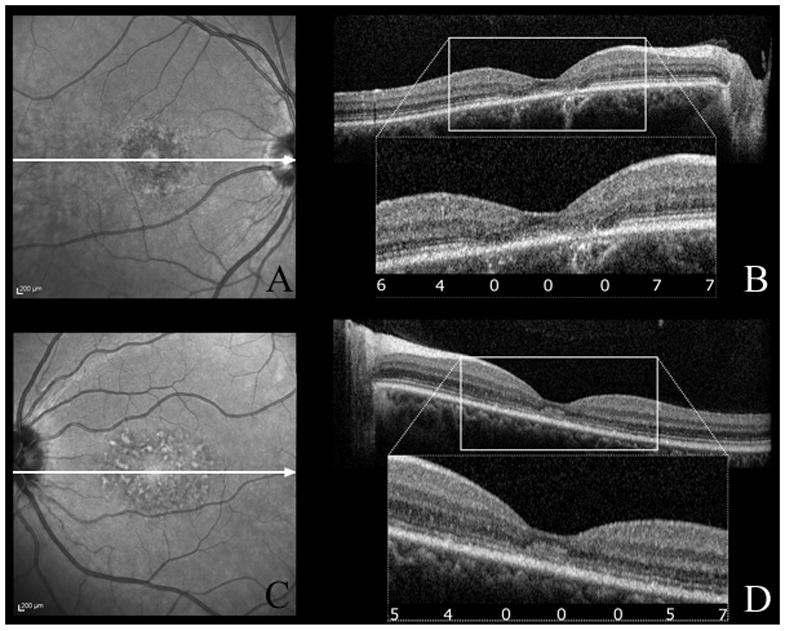
Figure 2.

cSLO infrared images (A,C) and corresponding SD-OCT scans (B,D) of patient 3 (A,B) and patient 6 (C,D). The white arrows indicate the direction of the SD-OCT scans. SD-OCT show ISe disorganization in the fovea with normal appearing outer nuclear layer and RPE layers, and normal ISe outside the foveola. The numbers in the box show dark-adapted sensivity results (expressed in dB) corresponding to those areas. Scotopic sensitivity loss (4,5,6 dB) was observed in the absence of structural changes on SD-OCT and cSLO (B,D).
