
Figure 6. In vivo fluorescence imaging.
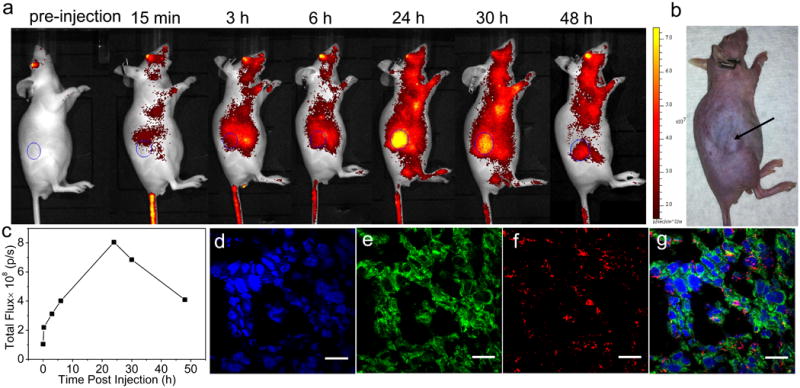
(a) Time-dependent fluorescence images of CT26 tumor bearing mouse showing increasing tumor contrast due to the accumulation of 1P′ inside the tumor. (b) Digital camera image of the same mouse showing the tumor position. (c) Measurements of the fluorescence intensity of the tumor region (circular ROIs shown in (a)). (d)-(g) are confocal fluorescence images of CT26 tumor cells. Channels are: DAPI nuclear stain (blue), apoptosis by TUNEL assays (green), and Chlorin e6 from the particles (red). Scale bars = 20 μm.