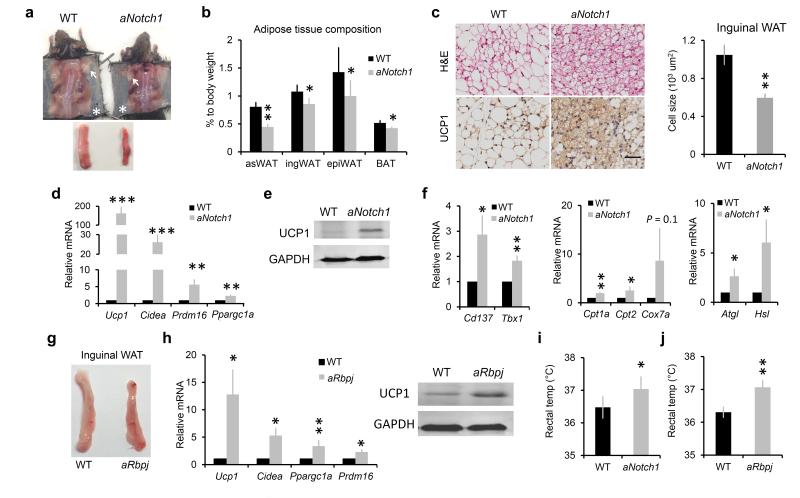
Figure 1.
Browning phenotype of WAT in Notch mutant mice. (a) Representative images of anterior-subcutaneous WAT (arrows) and IngWAT (asterisks), lower panel shows IngWAT. (b) Ratio of adipose tissue weight to body weight, n = 7 except for epiWAT (n = 9). (c) Representative images of Hematoxylin & Eosin (H&E) and UCP1 staining of IngWAT (left), scale bar, 50 μm, and average inguinal adipocyte size (right). (d–f) Relative expression of genes in WT and aNotch1 IngWAT, (f middle, n = 6), (f right, n = 8). (g) Representative images of IngWAT from WT and aRbpj mice. (h) Gene expression in IngWAT. (i,j) Rectal temperature measurement, (j, n = 7). *P < 0.05, **P < 0.01, ***P < 0.001. Data are means ± SEM. n = 4 pairs of mice unless otherwise indicated.

