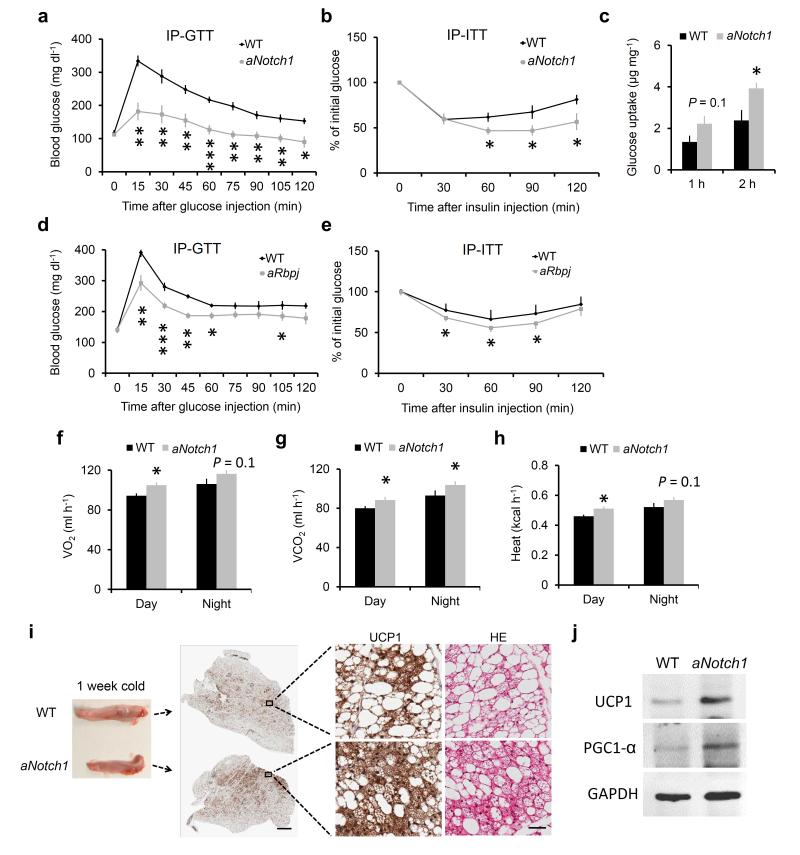
Figure 2.
Improved glucose metabolism in Notch mutant mice. (a,b) Blood glucose concentrations during IP-GTT (a) and IP-ITT (b) performed on 2–4 month-old WT and aNotch1 mice, n = 6. (c) Insulin stimulated glucose uptake of IngWAT explant from fasted 2–4 month-old WT (n = 4) and aNotch1 mice (n = 3). (d,e), IP-GTT (d, n = 4) and IP-ITT (e, n = 10) on 2–4 month-old WT and aRbpj mice. (f–h) Average day and night O2 consumption, CO2 production, and heat production, n = 6. (i) Representative histological analysis result of IngWAT from aNotch1 and WT mice treated at 4 °C for 1 week, scale bar, 1 mm (middle), 50 μm (right). (j) Western blot result of sample as in panel i. *P < 0.05, **P < 0.01, ***P < 0.001. Data are means ± SEM.

