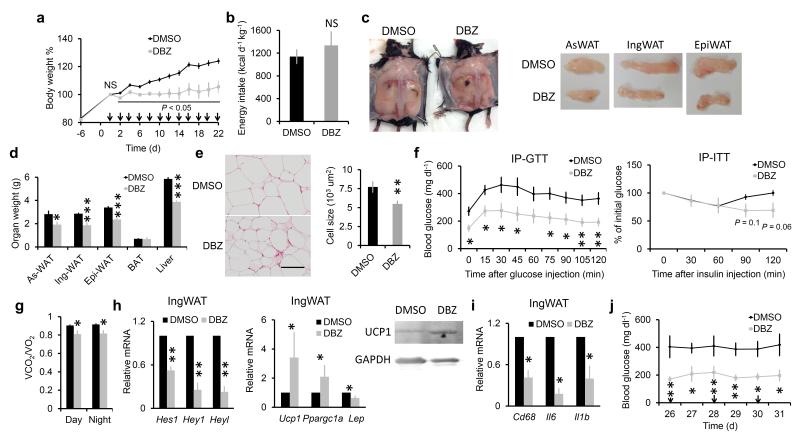
Figure 6.
Inhibition of Notch in Lep deficient obese mice (Lepob) ameliorates obesity and glucose metabolism. (a) Body weight ratio normalized to day 0, arrows mark doses of DMSO or DBZ injection. (b) Energy intake assay. (c) WAT images, anterior subcutaneous WAT (as-WAT). (d) Tissue weight. (e) H&E staining result of IngWAT, and adipocyte size. (f) Plasma glucose measurement during IP-GTT (left), or during IP-ITT (right). (g) Respiration exchange ratio of mice after treated with DMSO or DBZ for 22 days. (h,i), Relative expression of Notch targets (h left), adipocyte genes (h middle), UCP1 protein (h right), and inflammation-related genes (i) in IngWAT. (j) Fed-plasma glucose concentrations at dates shown, arrows indicate DMSO or DBZ injection (started from day 0 as shown in panel a). *P < 0.05, **P < 0.01, ***P < 0.001. Data are means ± SEM, n = 5.

