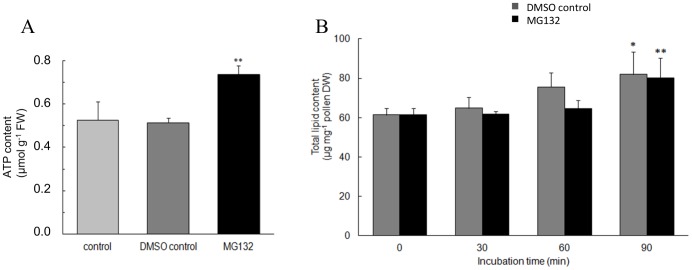
Figure 3. ATP and total lipid content.
A) ATP content in control, 0.08% DMSO-control or 40 µM MG132-treated kiwifruit pollen after 90 min of incubation. Asterisks indicate statistically significant differences relative to controls. FW, fresh weight. B) Lipid content at different times of germination in the presence of MG132 or 0.08% DMSO. Asterisks indicate statistically significant differences compared with the respective time zero. DW, dry weight. All data are the means ± SD of two independent experiments each with three biological replicates.

