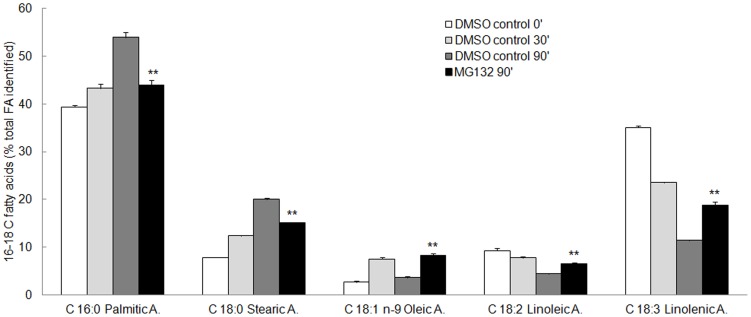
Figure 4. Fatty acid profile in kiwifruit pollen at different times of incubation in the presence of 0.08% DMSO (DMSO-control) or 40 µM MG132.
Each fatty acid was identified by comparing its fragmentation pattern with the mass spectrometer database. Results of triplicate analysis were averaged and the content of individual fatty acids in pollen was expressed as percentages of the total fatty acids identified ± S.D. Asterisks indicate significant differences compared with the respective DMSO-control. In some cases bars are too close to be visible. FA, fatty acids.

