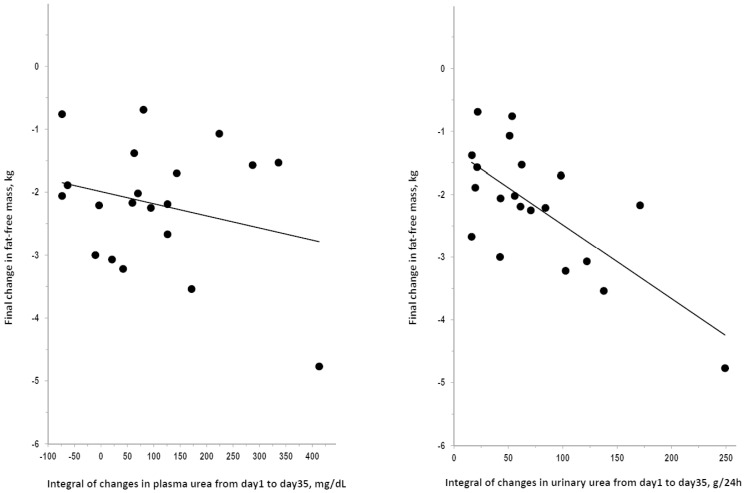
Figure 3. Correlation of changes in plasma and urinary levels of urea with changes in fat-free mass after bedrest.
Plot of the after-bedrest final change in fat-free mass over the integral of changes from day1 to day35 of bedrest in plasma urea (R = 0.259, P = 0.270) and in urinary urea (R = 0.706, P<0.001). The correlation coefficient for the integral of changes in urinary urea was significant also after exclusion of the case with fat-free mass change below −4 kg (R = 0.494, P = 0.032) and with control for baseline values of the variables (partial R = 0.687, P = 0.002).

