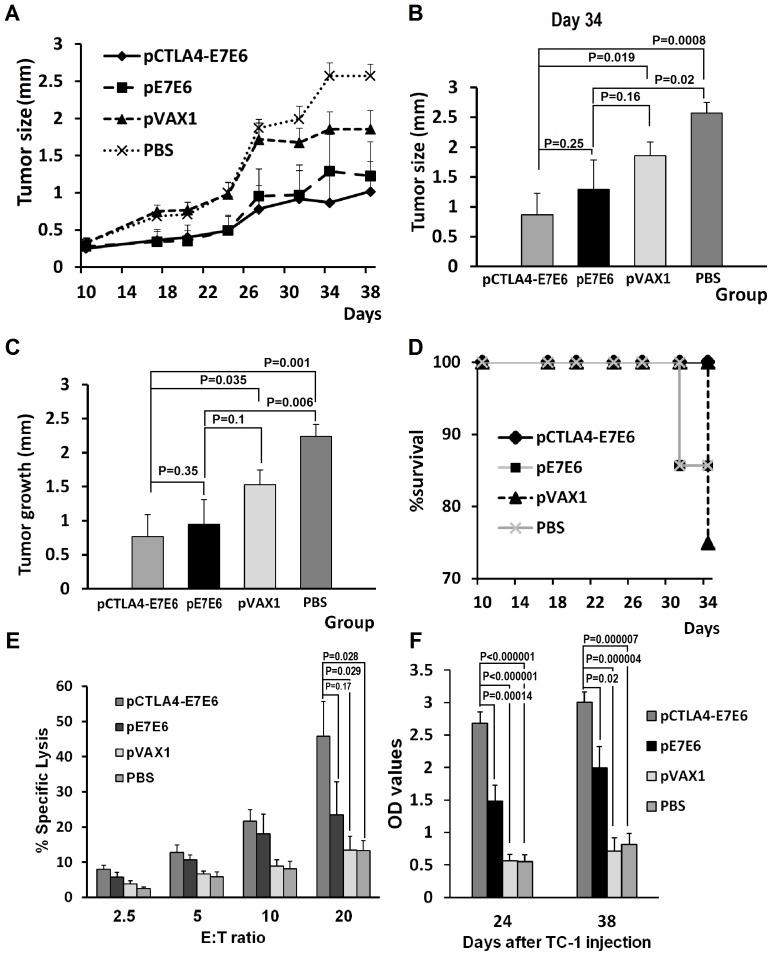
Figure 4. Anti-tumor therapeutic efficacy of pCTLA4-E7E6.
(A) Effects on tumor growth by therapeutic vaccination. Tumor-carrier mice were vaccinated with pCTLA4-E7E6, pE7E6, pVAX1 or PBS twice on day 10 and 17 after TC-1 cells injection. Tumor size was recorded twice or thrice a week. (B) Statistic analysis of tumor sizes on day 34 among groups. The graph shows means ± SE. (C) Statistic analysis of tumor development between day 10 and day 38 among groups. (D) Kaplan-Meier survival analysis of mice survival in different groups. (E) Tumor specific CTL responses. Spleen cells were collected from alive mice in different groups on day 38 and used as effector (E) cells. TC-1 cells were used as target (T) cells. The cellular immune response against E7E6 was determined by lactate dehydrogenase (LDH) release assay. Various E/T ratios were tested as indicated. The data were presented as means ± SE. (F) The levels of specific anti-E7E6 serum IgG were determined by ELISA assay on day 24 and 38. The antibody levels of each group were presented as mean OD values ± SE.

