
Figure 2.
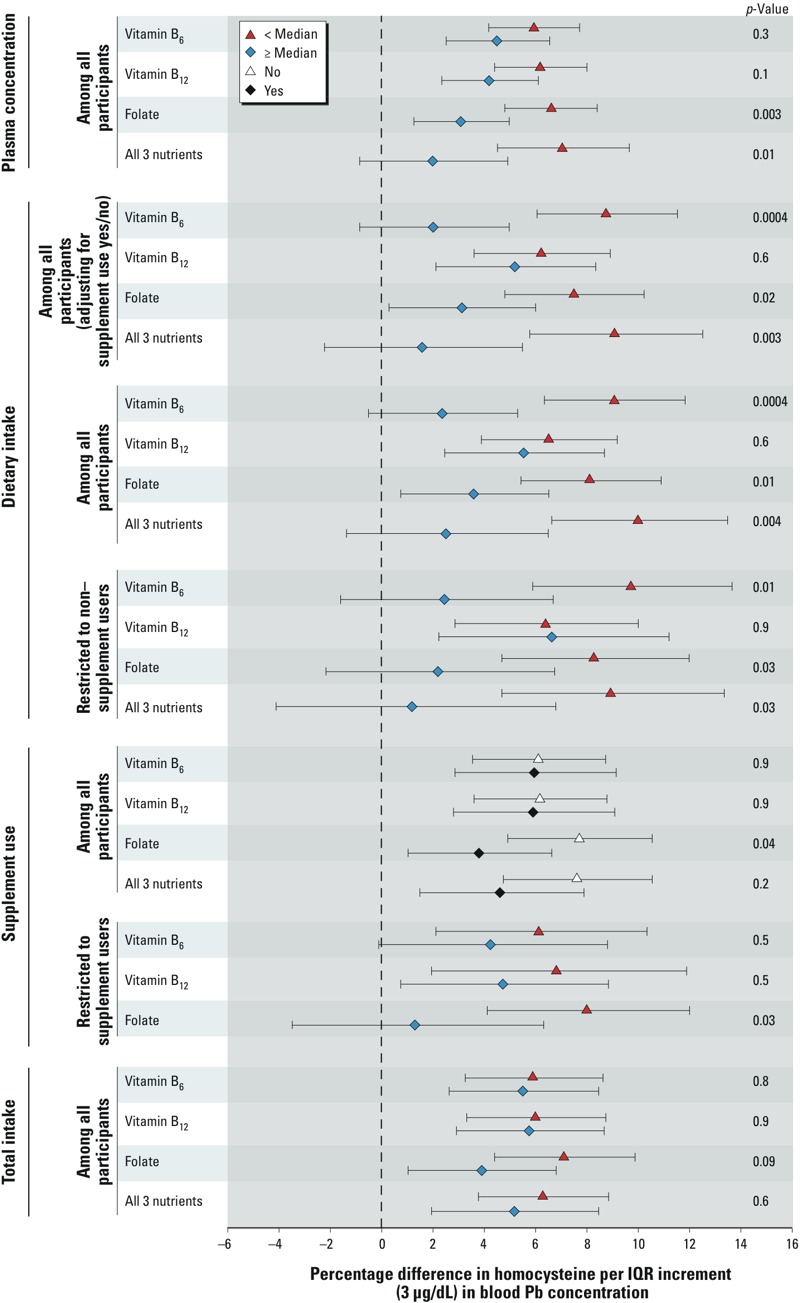
Adjusted percentage difference in homocysteine per IQR increment in blood Pb concentration by nutrient status level. All analyses were adjusted for age, education, alcohol consumption, smoking status, and BMI.
Official websites use .gov
A
.gov website belongs to an official
government organization in the United States.
Secure .gov websites use HTTPS
A lock (
) or https:// means you've safely
connected to the .gov website. Share sensitive
information only on official, secure websites.
Adjusted percentage difference in homocysteine per IQR increment in blood Pb concentration by nutrient status level. All analyses were adjusted for age, education, alcohol consumption, smoking status, and BMI.