
Figure 4.
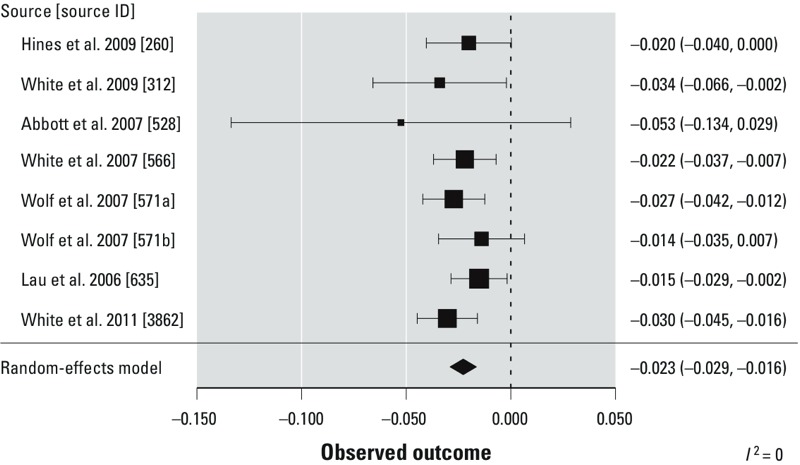
Meta-analysis results from a two-step mixed-effects model using combined relevant mouse studies in which dams were treated with PFOA via gavage and progeny weight was measured at or soon after birth. Data are presented as the mean (95% CI) change in body weight (g) per 1-unit increase in dose (mg/kg BW/day). Each box represents the dose–response slope estimate for a study; the midpoint of the box is the slope estimated for that study, and the box area is proportional to the weight given to each study in the meta-analysis. The diamond is centered at the overall meta-analysis slope estimate. Wolf (2007) was split into two data sets: a) cross-foster (exposure on GDs 1–17), and b) windows of sensitivity (exposure groups for GDs 7–17, GDs 10–17, GDs 13–17, and GDs 15–17).