
Figure 2.
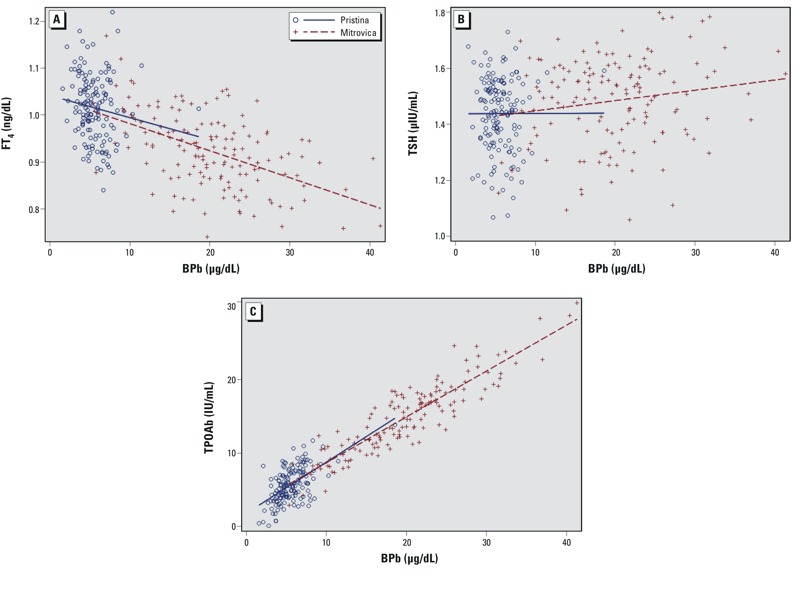
Scatter plots of measured values for each outcome according to BPb (μg/dL). (A) FT4 adjusted for height, ethnicity, BMI, fetal gestational age, maternal education, adults per room. (B>) TSH adjusted for hemoglobin, ethnicity, BMI, fetal gestational age, maternal age. (C) TPOAb adjusted for ethnicity, fetal gestational age, maternal age, adults per room.