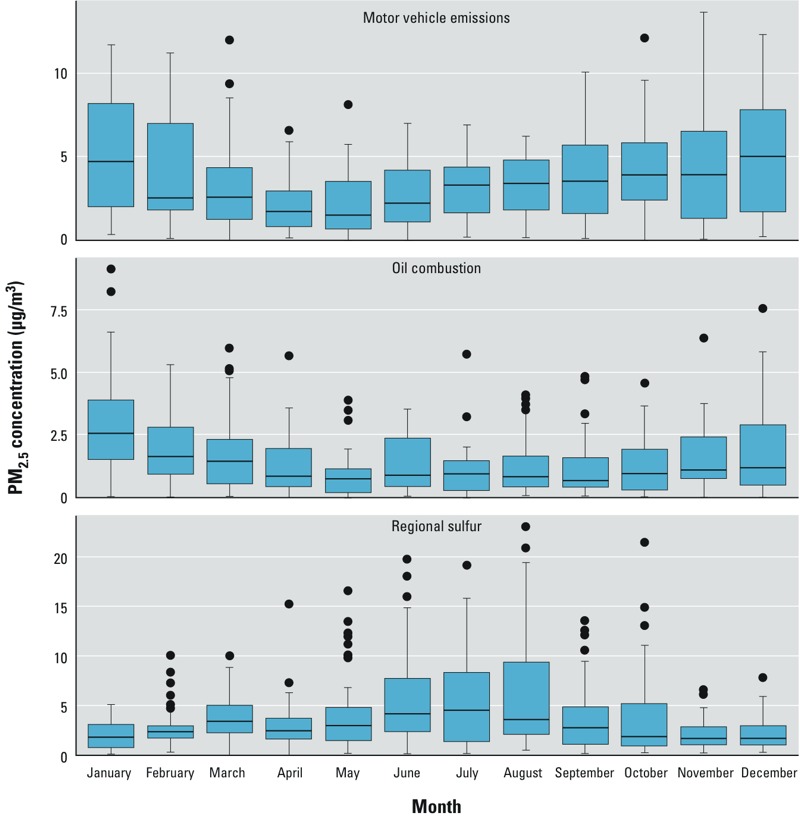
Figure 1.

PM2.5 concentrations attributable to motor vehicle emissions, oil combustion, and regional sulfur, by calendar month in Hartford, CT. Boxes extend from the 25th to the 75th percentile, horizontal bars represent the median, whiskers extend 1.5 times the length of the IQR above and below the 75th and 25th percentiles, respectively, and outliers are represented as points. The numbers of samples in each month were as follows: January, 37; February, 41; March, 48; April, 49; May, 50; June, 43; July, 40; August, 50; September, 51; October, 47; November, 38; December, 39.
