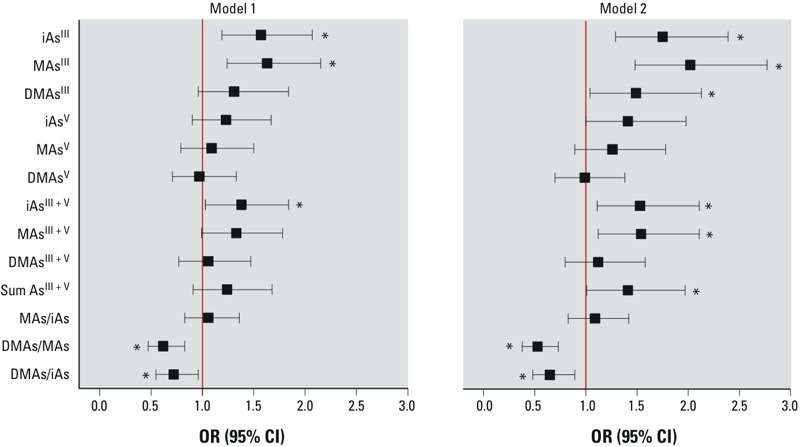
Figure 3.

Association of diabetes with As species in EUC. In model 1, diabetes was classified by either FPG ≥ 126 mg/dL, 2HPG ≥ 200 mg/dL, or self-report of doctor diagnosis or use of medication for treatment of diabetes; in model 2, diabetes was classified only by FPG ≥ 126 mg/dL or 2HPG ≥ 200 mg/dL. ORs (95% CIs) are standardized to an increment of 1 IQR and adjusted for age, sex, and BMI. IQRs for each As species and species ratio are shown in Table 2. See Supplemental Material, Table S3, for numeric data. *p < 0.05.
