Figure 2.

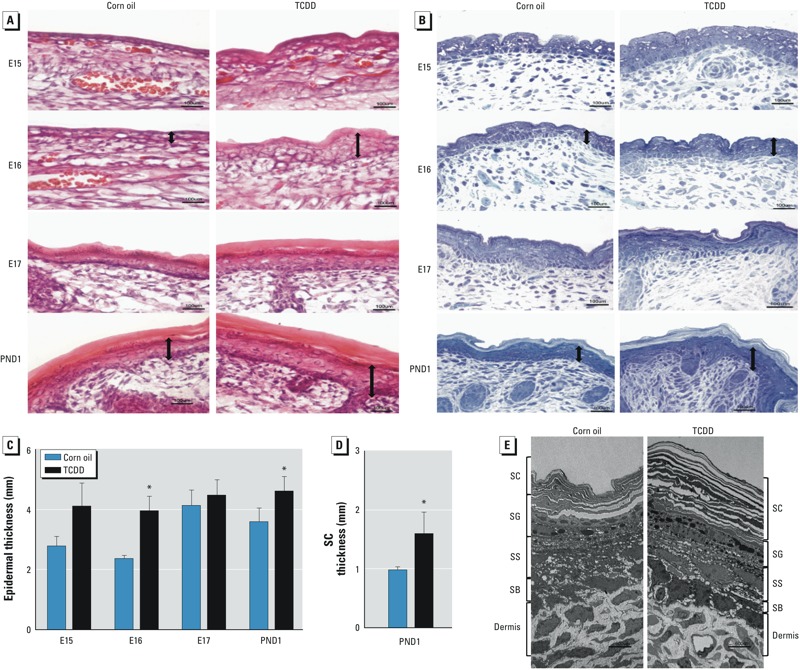
Epidermal abnormalities after in utero TCDD exposure. (A) Photomicrograph of epidermis showing H&E staining of frozen sections of representative embryos and pups. (B) Photomicrographs of semithin-sectioned murine skin stained with toluidine blue. Images are representative for each time point and treatment condition. Double-headed arrows identify examples of the relative thickness of the epidermal layers corresponding to acanthosis. Bars = 10 μm. (C) Quantification of epidermal thickness by microscopy. (D) Quantification of SC thickness at PND1 by microscopy. In C and D, data are means ± SDs (n = 3). (E) Photomicrograph of ultrathin skin section of PND1 mice analyzed by TEM. Bar = 600 μm. Abbreviations: SB, stratum basale; SS, stratum spinosum. *p < 0.05, compared with age-matched control samples by Student’s t-test.
