
Figure 3.
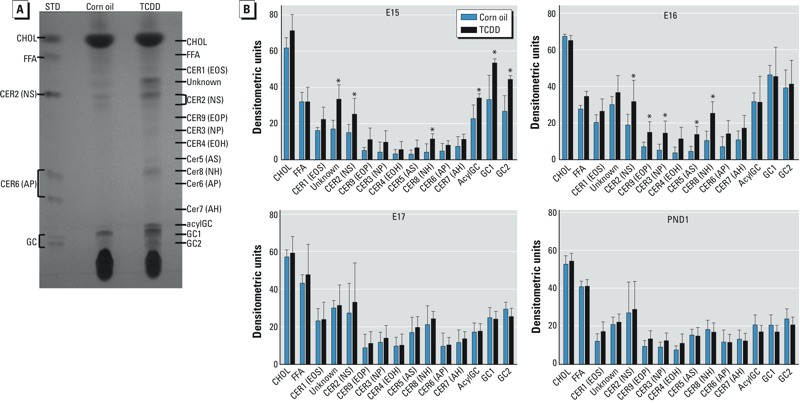
Increases in the level of certain ceramides at E15 and E16 in TCDD-exposed embryos. (A) Representative photograph of epidermal lipids separated by HPTLC; the ceramide structures are named based on the sphingoid base (S, sphingosine; P, phytosphingosine; H, 6-hydroxysphingosine) and the N-acyl fatty acid (A, α-hydroxy group; O, ω-hydroxy group; E, acylated in the ω-hydroxy position). Abbreviations: acylGC, acylglucosylceramide; CER, ceramide; CHOL, cholesterol; FFA, free fatty acid; GC, glucosylceramide; STD, standard. (B) Quantification of lipid bands by densitometry. Data are means ± SDs (n ≥ 3). *p < 0.05, compared with age-matched control samples by Student’s t-test.