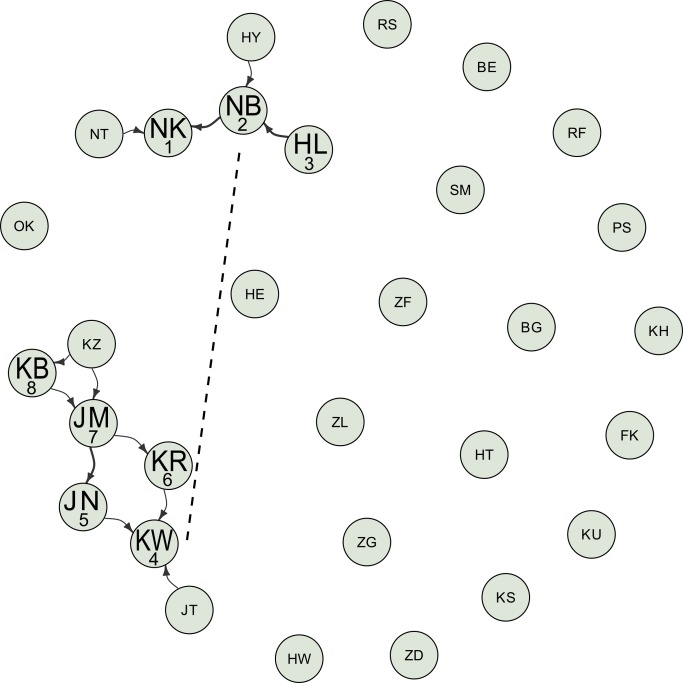
Figure 1. Visualization of the static interaction networks for the moss-sponging behavior for all 30 individuals.
Graphs are laid out using the Fruchterman–Reingold weighted algorithm. Labels on the nodes indicate the identity of individuals (see Supporting Information). Individuals with large label size developed the behavior, whereas individuals with small label size did not. Numbers under the large label indicate the order of acquisition of the behavior. The width of the arrows linking individuals is proportional to the number of times an interaction event was recorded between any two individuals and represented according to the convention “X→Y” means that Y was observed by X. Dashed line indicates potential product-based social learning by individual KW who re-used a moss-sponge. Data were deposited in the Dryad repository: http://dx.doi.org/10.5061/dryad.m6s21.

