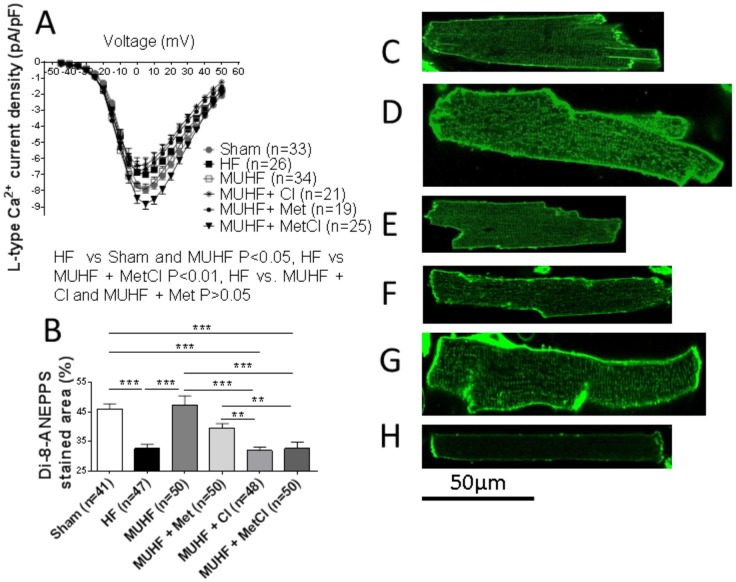
Figure 5. MU-induced recovery of depressed L-type Ca2+ current (A) and t-tubule density (B).
Maintenance of L-type Ca2+ current recovery by combined MetCl therapy, and antagonism of such recovery by Cl or Met mono-therapy (A) is shown, along with antagonism of t-tubule density recovery by all treatments (B). *P<0.05, **P<0.01 and ***P<0.001. Representative di-8-Anepps stained cells from sham (C), HF (D), MUHF (E), MUHF+Cl (F), MUHF+Met (G) and MUHF+MetCl (H) groups are shown. Data for the Met group has been previously published [22] and added here for comparison.

