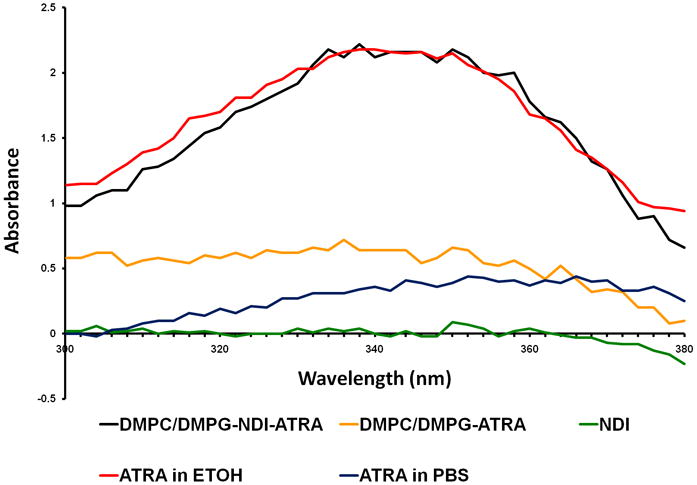
Figure 3.

UV spectroscopy of ATRA. NDI-ATRA in PBS (black line) displays a normal ATRA absorption spectrum with peak between 341-350 nm. NDI in PBS alone (green line) has no spectral properties while the DMPC/DMPG-ATRA control in PBS (yellow line) did not retain significant levels of ATRA following excess lipid/drug centrifugation and sterile filtration. An equal concentration of ATRA in ethanol (red line) has a similar spectrum as NDI-ATRA in PBS. However, the spectrum for ATRA in PBS (blue line) is mostly attenuated.
