
Figure 4.
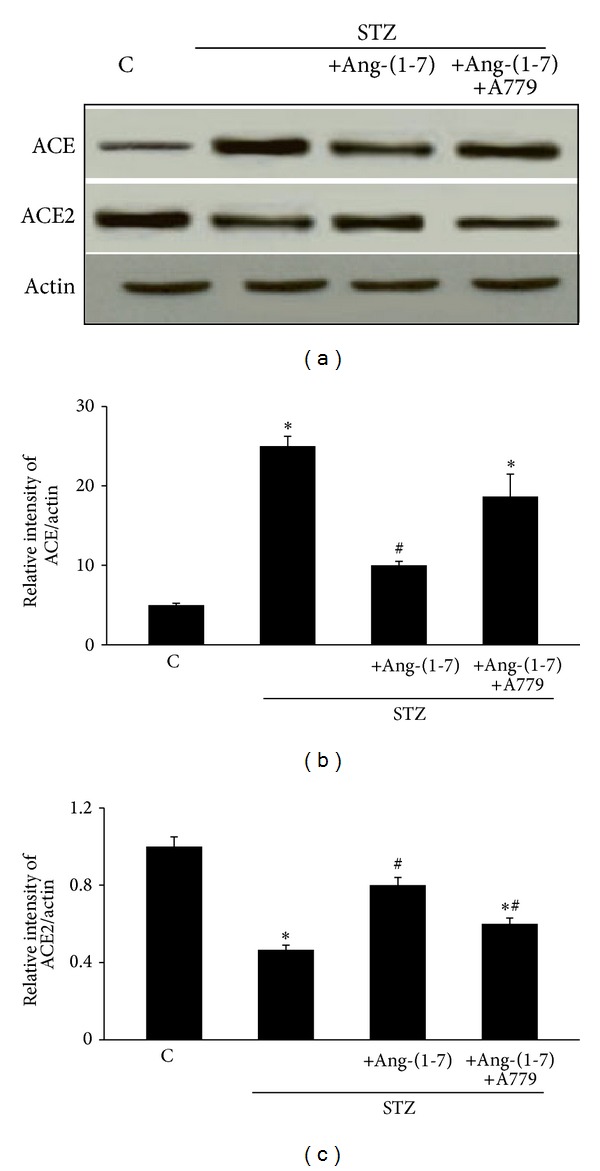
The levels of ACE and ACE2 protein expression in corpus cavernosum of nondiabetic (C), diabetic (STZ), and STZ-rats chronically treated either with Ang-(1-7) alone (STZ + Ang-(1-7)) or in combination with A779 (STZ + Ang-(1-7) + A779). Panel (a) is a representative western blot showing the levels of ACE, ACE2, and the protein loading control, β-actin. Panels (b) and (c) are densitometry histograms showing levels of ACE and ACE2 normalized to actin, respectively. N = 4; Mean ± SD. Asterisk (∗) indicates significantly different (P < 0.05) mean values from normal nondiabetic rats (C), whereas hash (#) indicates significantly different mean values (P < 0.05) from diabetic rats (STZ).