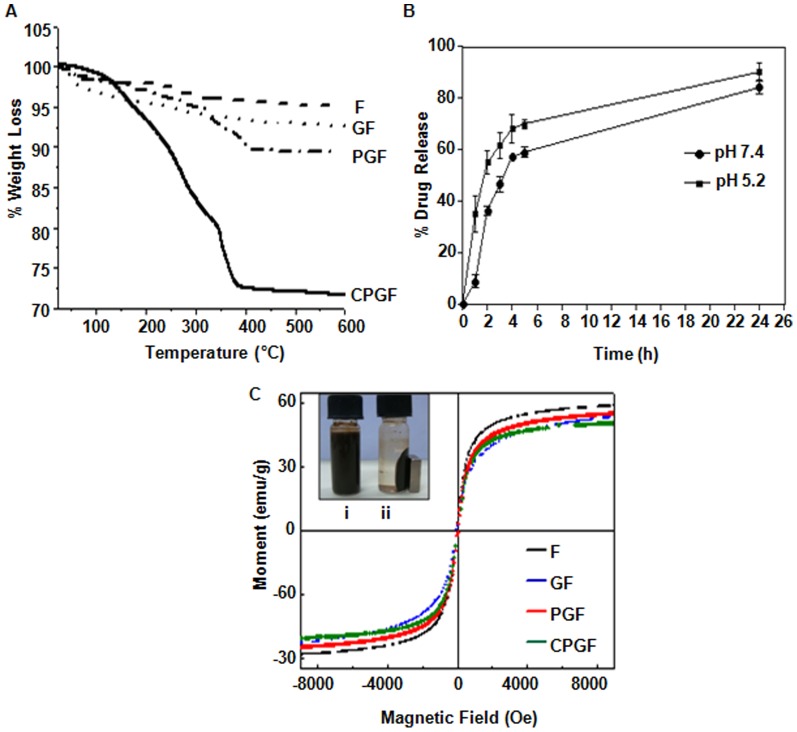
Figure 3. Cinnamaldehyde loading and release profiles along with magnetic behavior of CPGF NPs.
(A) Thermogravimetric analysis of F, GF, PGF and CPGF NPs. (B) Release profile of cinnamaldehyde from CPGF NPs at different pH values at different time points. (C) Inset shows uniform suspension of CPGF NPs (i) and (ii) response of the NPs to the externally placed magnet. VSM data shows the magnetic behavior of all the NPs.

