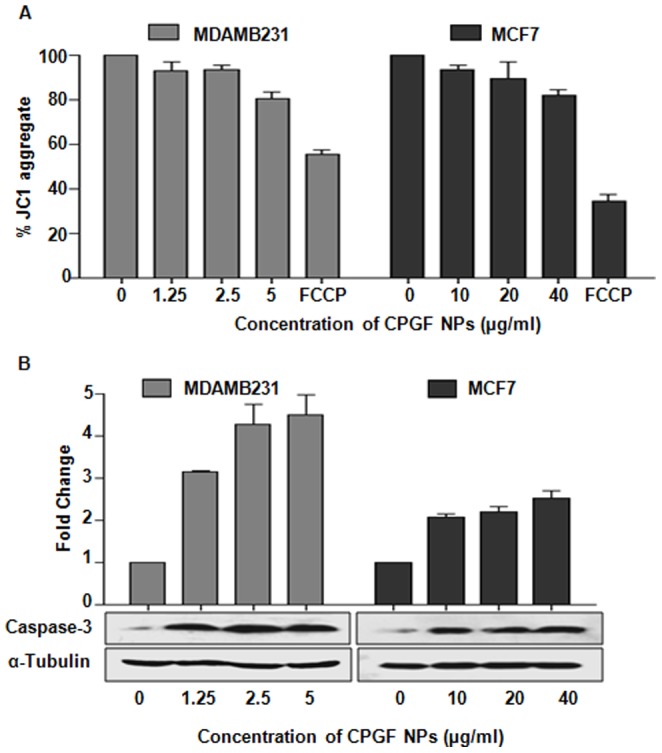
Figure 8. CPGF NPs induce apoptosis in breast cancer cells.

(A) CPGF NPs decreased the mitochondrial membrane potential of the breast cancer cell lines as observed by JC-1 staining. The data was analyzed by the MARS data analysis software 2.10R3 (BMG Labtech). All data are presented as means±SD of three independent experiments. p<0.0001 indicate statistically significant differences compared to the control untreated group. (B) Western blot data shows increase in caspase-3 expressions in both MDAMB231 and MCF7. α-Tubulin was used as a loading control. The histogram depicts densitometric analysis of western blots of caspase-3. Values are represented as mean±SD of three independent experiments. p<0.001 indicate statistically significant differences compared to the untreated control cells.
