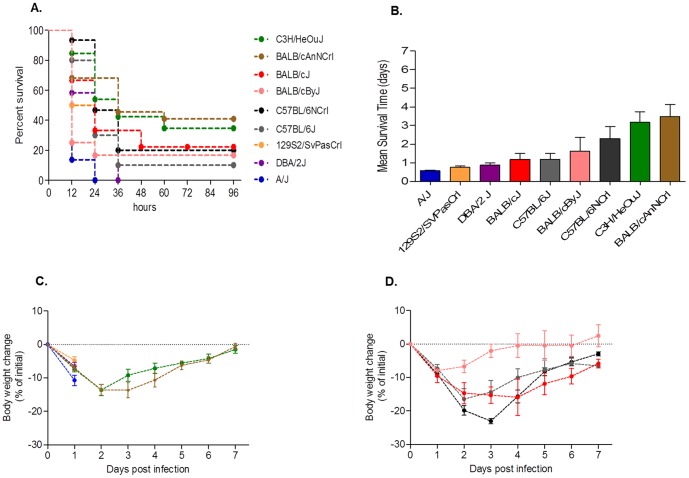
Figure 1. Survival, body weight and mean survival time after P. aeruginosa infection in inbred mouse strains.
A/J (n = 22), BALB/cJ (n = 9), BALB/cAnNCrl (n = 8), BALB/cByJ (n = 12), C3H/HeOuJ (n = 26), C57BL/6J (n = 10), C57BL/6NCrl (n = 15), DBA/2J (n = 12), and 129S2/SvPasCRL (n = 12) mice were inoculated with 5×10⁶ CFU of P. aeruginosa clinical isolate AA2, and monitored for survival (A) and weight change for a period of seven days after infection (C, D). In addition, mean survival time was calculated based on the survival curve (B). Bar represent mean values and the error bars the standard error of the mean (SEM). The data are pooled from two to four independent experiments. Statistical significance by Mantel-Cox test for survival (A), One- way ANOVA with Bonferroni's Multiple comparison test (B) for mean survival time and Two-way ANOVA with Bonferroni's Multiple comparison test (C, D) is reported in Table S1–S3.

