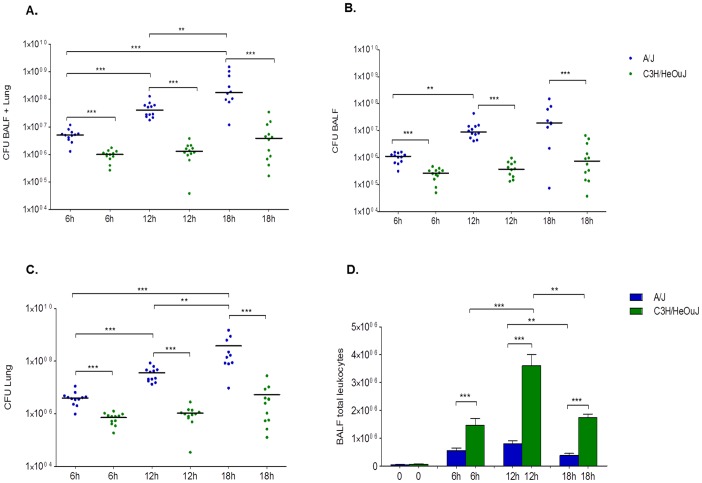
Figure 2. P. aeruginosa load and leukocytes recruitment in BALF and lung of A/J and C3H/HeOuJ mice.
A/J (n = 12, for each time) and C3H/HeOuJ (n = 12, for each time) mice were challenged with 5×10⁶ CFU of AA2 clinical stain and analysed during a time course post-infection. Bacterial loads in the BALF+Lung (A), BALF (B) and lung (C) and were counted at 6, 12 and 18 hours in surviving mice. Dots represent CFUs in individual mice and horizontal lines represent median values reported in log scale. Total leukocytes were analyzed in BALF of P. aeruginosa infected mice (D). Bars represent median values and the error bars indicate the standard error of the mean (SEM). Blue is referred to A/J and green to C3H/HeOuJ. The data are pooled from two independent experiments. Statistical significance by Mann-Whitney U test is indicated: **p<0.01, ***p<0.001, ****p<0.0001.

