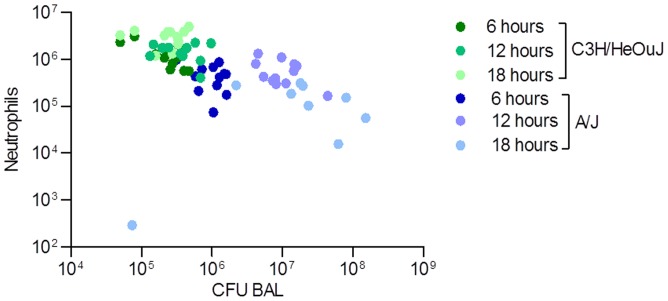
Figure 4. Correlation of CFU/neutrophils in the BAL of susceptible A/J and resistant C3H/HeOuJ P. aeruginosa-infected mice.
CFUs and neutrophils recovered in the BAL were plotted for the two murine strains during 18 hours of P. aeruginosa infection. Dots represent CFUs and neutrophils in individual mice. Blue dots represent A/J mice (n = 12, for 6 and 12 hours, n = 9 for 18 hours) and green dots C3H/HeOuJ mice (n = 12 for each time). The data are pooled from two independent experiment.

