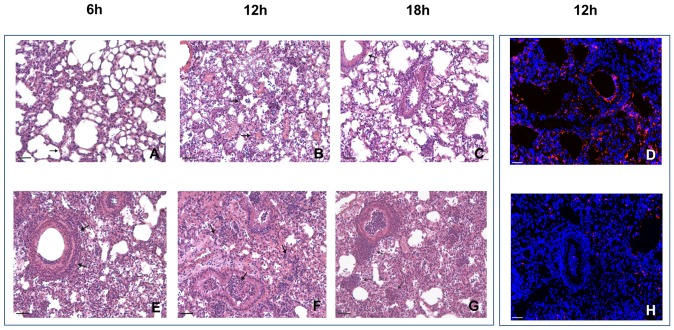
Figure 5. Histopathology in susceptible A/J and resistant C3H/HeOuJ P. aeruginosa-infected mice.
The lungs of A/J (A–D) and C3H/HeOuJ (E–H) were stained with H&E (A–C, E–H) and in immunofluorescence with specific antibody against P. aeruginosa (red) (D, H). Counterstaining was performed with 49,6-Diamidino-2-phenylindole dihydrochloride (DAPI) (blue). After time course analysis, extensive infection and inflammation were visible in murine lungs with major differences between A/J and C3H/HeOuJ. Arrows indicate aggregates of lynphocytes infiltrates. Bars, 200 µm for H&E images, 100 µm for immunofluorescence images. Severity of lesions and lung involvement was scored as reported in Fig S4.

