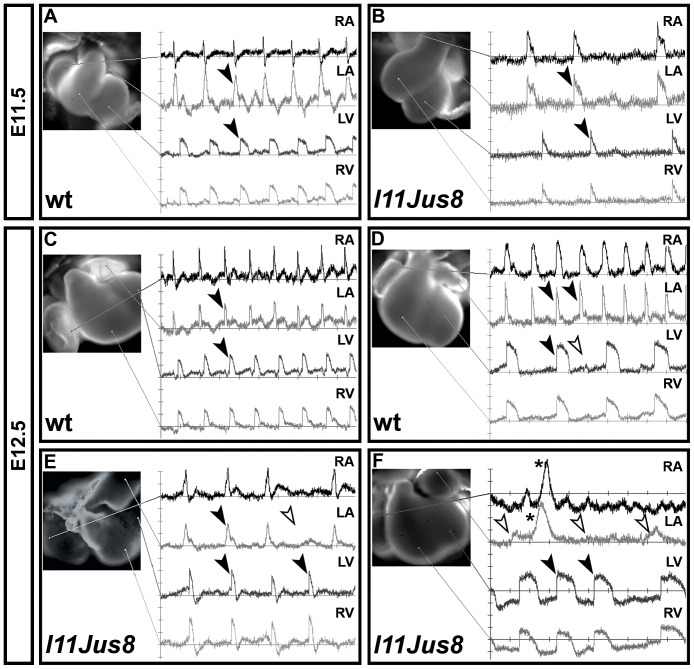
Figure 3. Optical mapping of the cardiac electrical activity obtained with di-4-ANEPPS voltage sensitive dye.
(A–B) and (C–F) show reading of E11.5 and E12.5 hearts, respectively. The location from which the electrical reading was taken is shown with lines onto the cardiac dissection image. Black arrowheads point to matched atrial and ventricular signals. (D) White arrowhead indicates absent signal in left ventricle corresponding to a present signal in left atria (black arrowhead), indicative of AV block. (E–F) White arrowheads indicate absent atrial signals corresponding to present ventricular signals (A block), a phenotype only present in mutant samples. Asterisks on RA and LA traces in (F) indicate signal described in Figure 5C . RA, right atrium; LA, left atrium; LV, left ventricle; RV, right ventricle.

