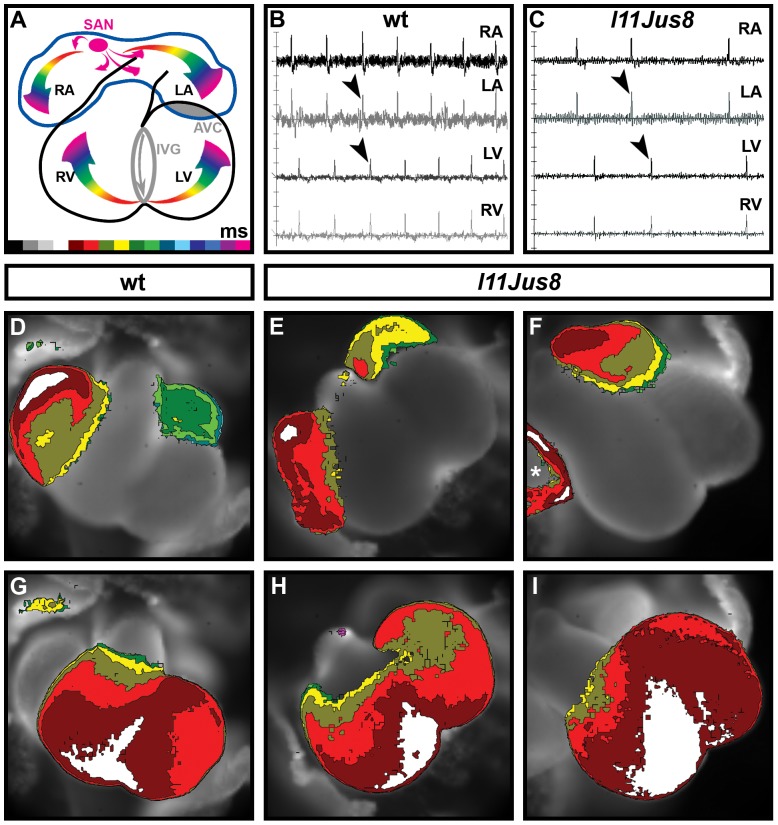
Figure 4. Mapping of electrical signal propagation in E11.5 hearts.
(A) Pattern of wild type electrical signal propagation in the E11.5-12.5 heart. Different colours encode the time scale of the signal conduction; each colour represents a one-millisecond interval with black as the initial time point and fuchsia as the final time point. (B–C) Derivatives of the signal recorded in wt and homozygous mutant l11Jus8 E11.5 hearts. Black arrowheads point to the peaks used for map generation. (D–F) Optical maps showing spatio-temporal propagation of the electrical signal through the atria. Asterisk on (F) points to the gap in normal electrical activity in homozygous mutant l11Jus8 atria. (G–I) Optical maps showing electrical signal propagation through the ventricles. Maps are similar for all genotypes. SAN, sinoatrial node; RA, right atrium; LA, left atrium; LV, left ventricle; RV, right ventricle; AVC, atrioventricular canal; IVG, interventricular groove.

