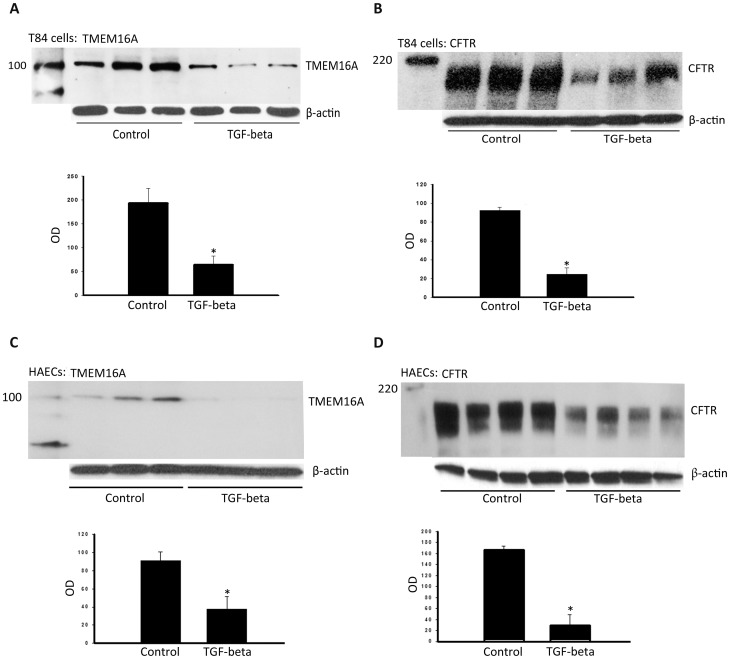
Figure 2. TGF-beta effects on TMEM16A and CFTR protein levels in T84 cells and HAECs.
Lysates of T84 cells (A and B) or HAECs (C and D) were prepared and subjected to PAGE and immunoblot with either anti-TMEM16A or anti-CFTR antibody. For each cell type, the upper gel panel shows TMEM16A (A and C) or CFTR (B and D) detection from three replicate samples (with or without 10 ng/ml TGF-beta exposure). The lower panels are summary densitometry data. T84 cells: *P = 0.01 for TMEM16A; *P = 0.01 for CFTR. HAECs: *P = 0.05 for TMEM16A; *P = 0.01 for CFTR.

