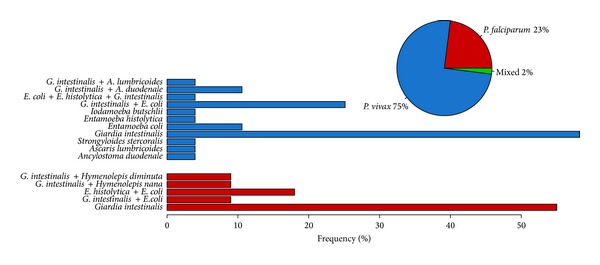
Figure 1.

Frequency of individuals infected with P. vivax (blue) and P. falciparum (red) in the population of study. In the barplot the specific frequency of each species of intestinal parasites discriminated by P. vivax and P. falciparum is represented.
