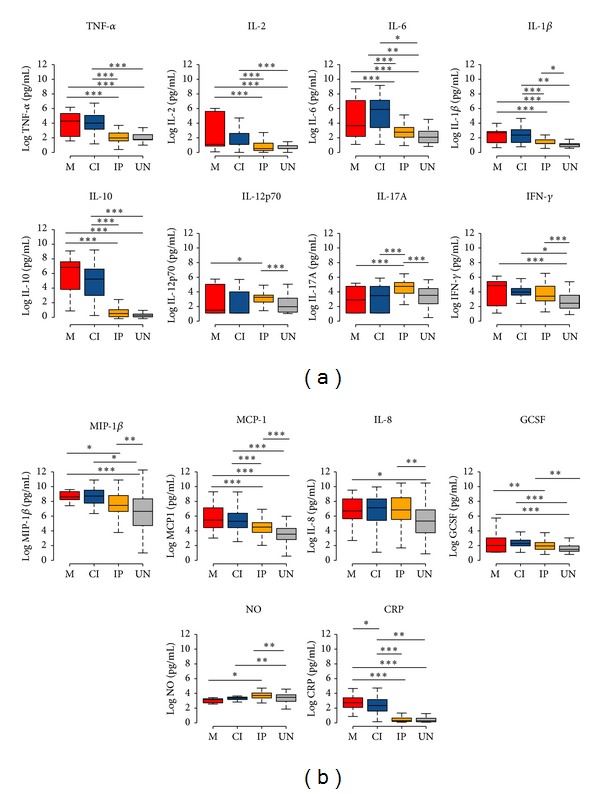
Figure 2.

Boxplots of the levels of (a) cytokines, (b) chemokines, and inflammation markers in the groups (M = red, CI = blue, IP = orange, and UN = gray). Differences were calculated using a TukeyHSD from a permutation ANOVA over cytokine values transformed with Log. Significant statistical differences are represented in the bars and the level of significance expressed as ∗∗∗P < 0.0001, ∗∗P < 0.001, and ∗P < 0.05.
