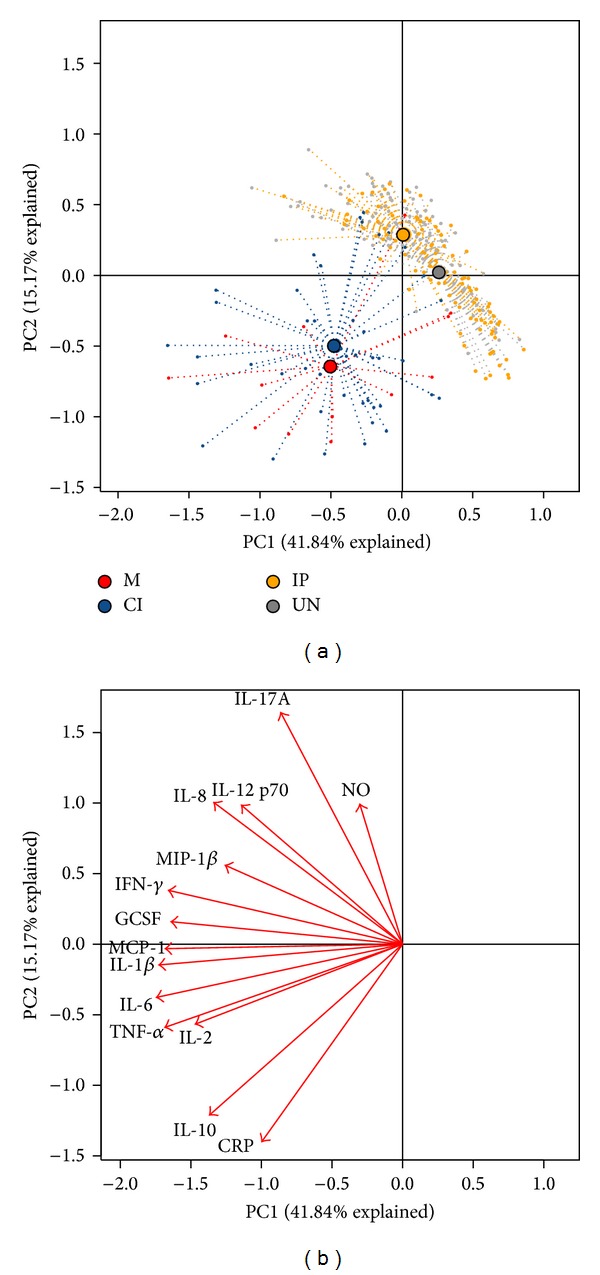
Figure 3.

Principal component analysis (PCA) of inflammatory mediators (cytokine, chemokines, CRP, and NO). (a) Results are shown for M, CI, IP, and UN groups. Each point represents an individual from a group and each group has a color code: M = red, CI = orange, IP = blue, and UN = gray. (b) Arrows indicating the direction of maximum change while the length of arrows represents the magnitude of the change. The explanation of the first principal component (PC1) explained 41.84% of the variation of the data and the second principal component (PC2) explained 15.17%. The separation of CI and M individuals from IP and EXP and the association of some cytokines with the different groups can be observed.
