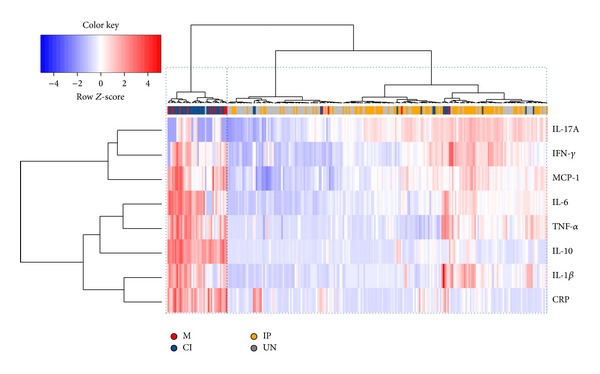
Figure 4.

Two-way coupled cluster analysis (heatmap). Each cell indicates the value of a single mediator of inflammation among the studied individuals. The horizontal cluster illustrates the grouping of individuals considering seventeen cytokines, C-reactive protein, and nitric oxide. The vertical cluster shows the grouping of mediator of inflammation such as cytokines meaning that cytokines that presented more similar responses are closer in the clusters. The red color in the cells indicates high values and the blue color indicates low values in the production of cytokines and inflammatory proteins. The white color indicates no changes in the cytokine levels. The colors under the horizontal cluster represent the groups (M = red, CI = orange, IP = blue, and UN = gray) of each individual. Sample clustering resulting from the algorithm applied is shown at the top of the graph as a horizontal dendrogram, with an indication of the group to which each individual sample belongs. The horizontal-dotted boxes show the clusters of individuals obtained. The first vertical box with dotted lines represents the group of individuals with malaria only (M) and malaria-intestinal parasites coinfected (CI). The second box shows the uninfected (UN) and IP individuals.
