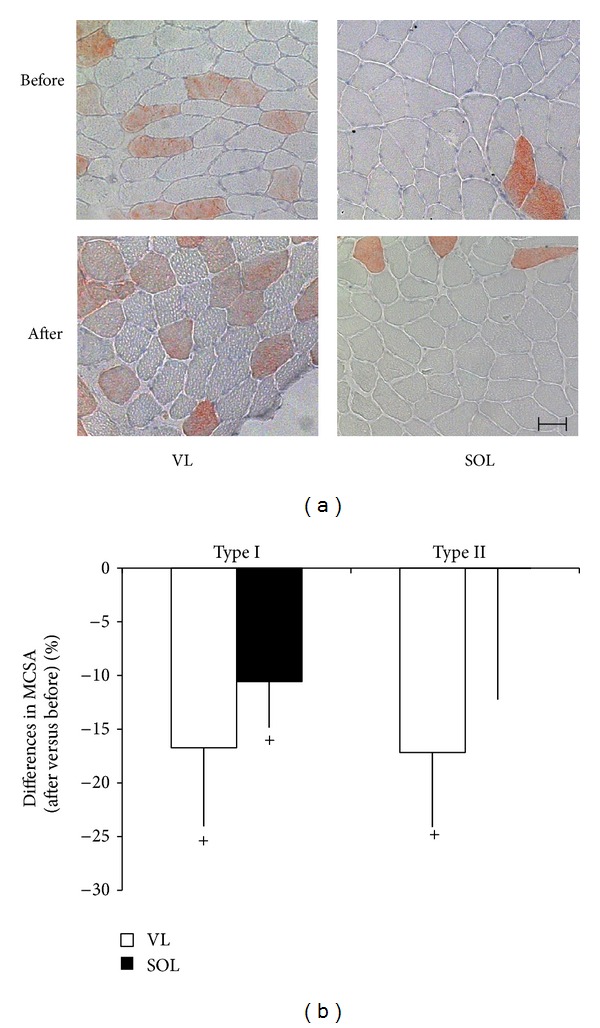
Figure 1.

Fibre types with unloading. (a) Microscopic pictures of muscle cross sections of SOL and VL before and after ULLS after staining for type II myosin type heavy chain (orange). Nuclei appear in blue. The bar indicates 50 micrometers. (b) Mean ± SE of changes in MCSA for type I and type II muscle fibres in VL and SOL muscle within 3 days of ULLS. + denotes 0.05 ≤ P < 0.10 (two-tailed Fisher test).
