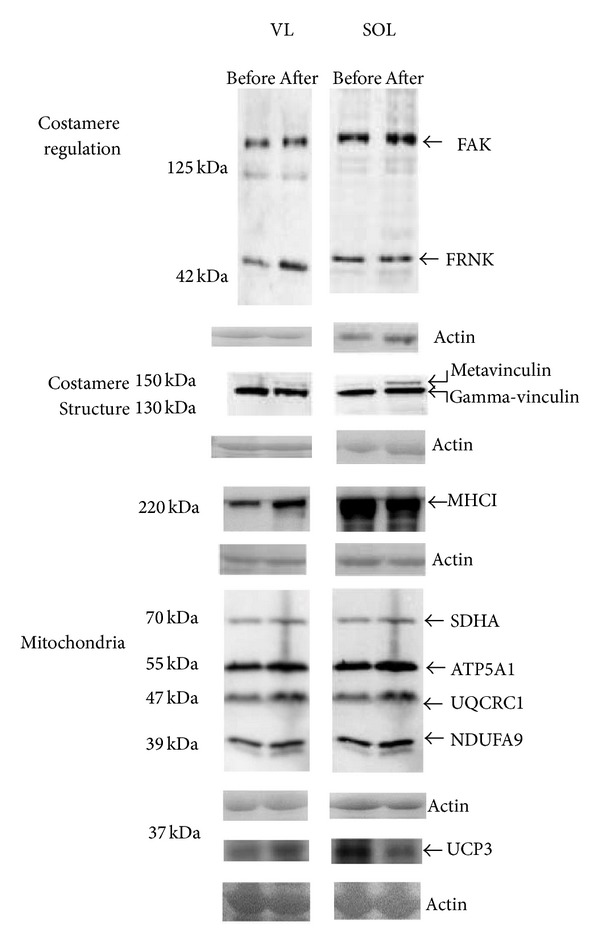
Figure 2.

Protein detection in SOL and VL muscle. Representative immunoblots visualizing the detected proteins in SOL and VL before and after 3 days of ULLS. Arrows indicate the protein bands of interest. Below each blot, a loading control visualizes the actin band of the respective samples on the Ponceau S stained membrane. The position of molecular weight markers is shown to the left.
