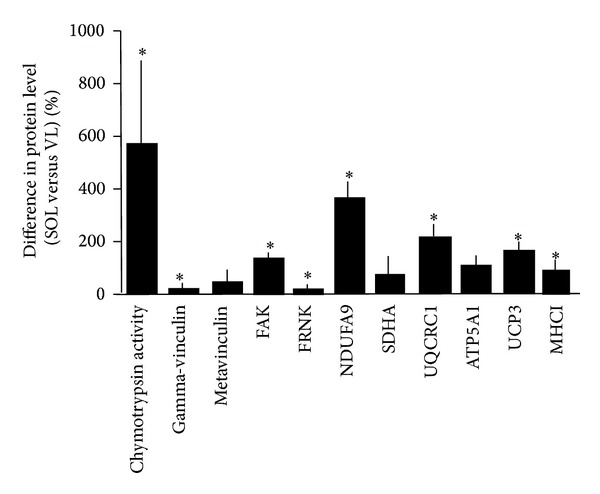
Figure 3.

Differences in protein expression in the studied muscles. Mean and standard error of the percentage difference between SOL and VL muscle for the levels of the assessed proteins. Asterisk denotes significant difference between the SOL and VL muscle (P < 0.05, repeated ANOVA with post hoc test of Fisher).
