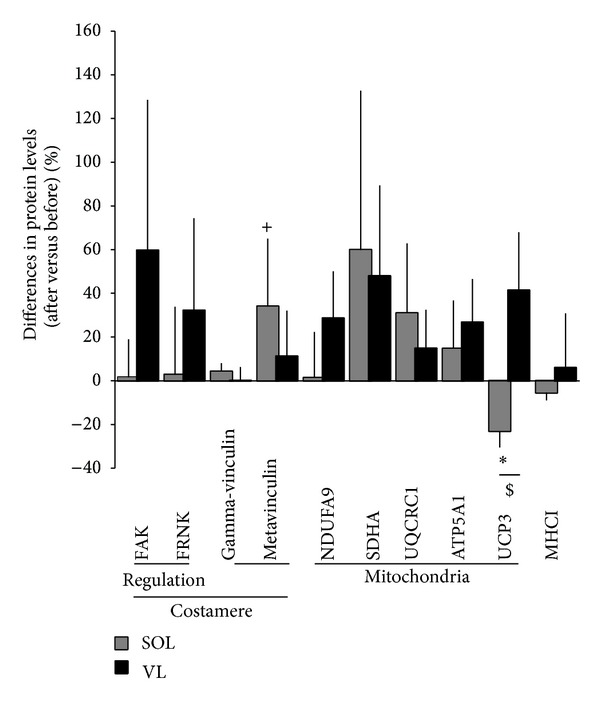
Figure 5.

Changes in protein content with unloading. Mean and standard error of protein level changes within 3 days of ULLS in VL and SOL muscle. Asterisk and cross indicate those gene ontologies and proteins which were significantly or as a trend affected by ULLS. ∗ and + denote P < 0.05 and 0.05 ≤ P < 0.10. $ indicates a significant interaction effect (P < 0.05, repeated ANOVA).
