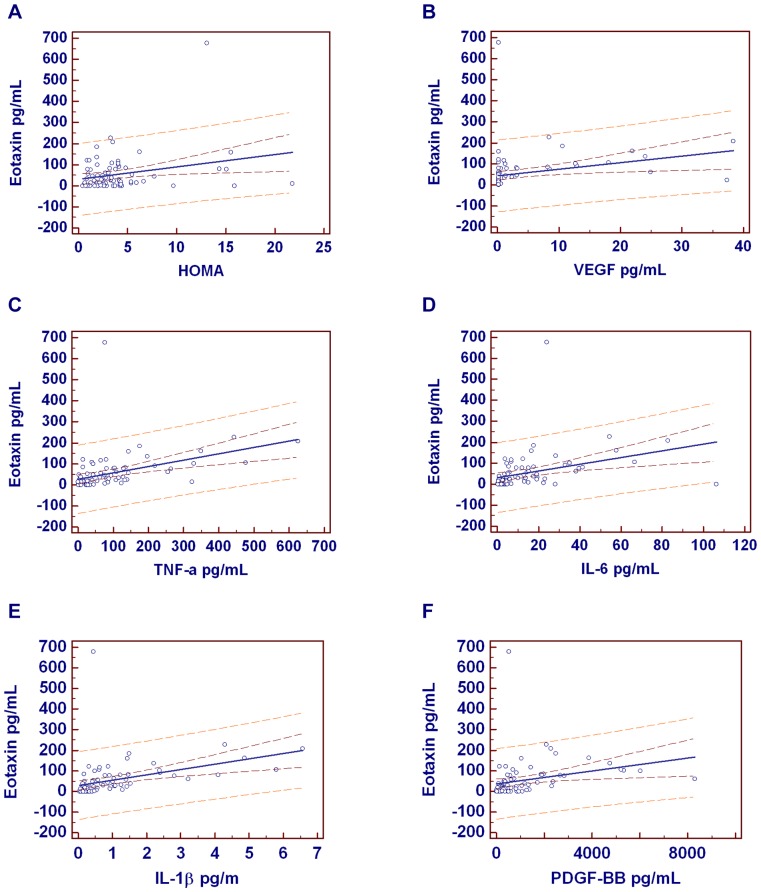
Figure 1. Graphics of significant predictions between eotaxin and other independent variables.
Eotaxin was well predicted by HOMA (r = 0.26, P = 0.019), VEGF (r = 0.27, P = 0.013), TNF-α (r = 0.405, P = 0.0002), IL-6 (r = 0.35, P = 0.0016), IL-1β (r = 0.38, P = 0.0005), PDGF-BB (r = 0.27, P = 0.015). Correlation coefficient r. The regression line is evidenced in blue; the 95% confidence in dark red and the 95% prediction in light red. Dependent Y = Eotaxin.

