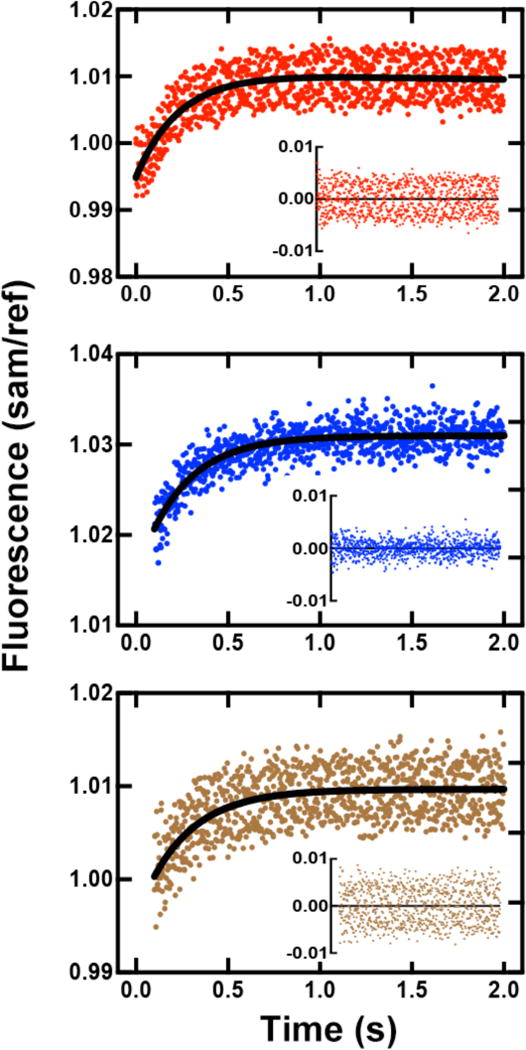
Fig. 8.

Estimation of rates of PPi formation and release as detected with PBP-MDCC. The DNA duplex was 24-/36-mer DNA duplex (X is G or 8-oxoG). Fluorescence changes were observed upon mixing of a pre-formed mixture of 2.0 μM Y50W, 2.1 μM DNA, and 1.0 mM DTT with 1.0 μM PBP-MDCC plus 100 μM dCTP at room temperature. Both syringes contained 10 mM Tris-HCl buffer (pH 8.0), 5 mM MgCl2, 5 mM NaCl, 0.005 Unit μL−1 PPase, and a phosphate “mop” (0.2 mM N7-methylguanosine and 0.2 U PNPase mL−1). Data were fit to a single-exponential model in OLIS Global Works to estimate the rates. (A) Y50W and DNA (x is 8-oxoG) mixed with 100 μM dCTP and PBP-MDCC, rate 4.7 ± 0.4 s−1. (B) Y50W and DNA8-oxoG mixed with 100 μM dCTP, rate 4.0 ± 0.3 s−1. (C) Y50W and DNA8-oxoG mixed with 100 μM dATP, rate 3.7 ± 0.6 s−1. Residuals are shown in the insets.
