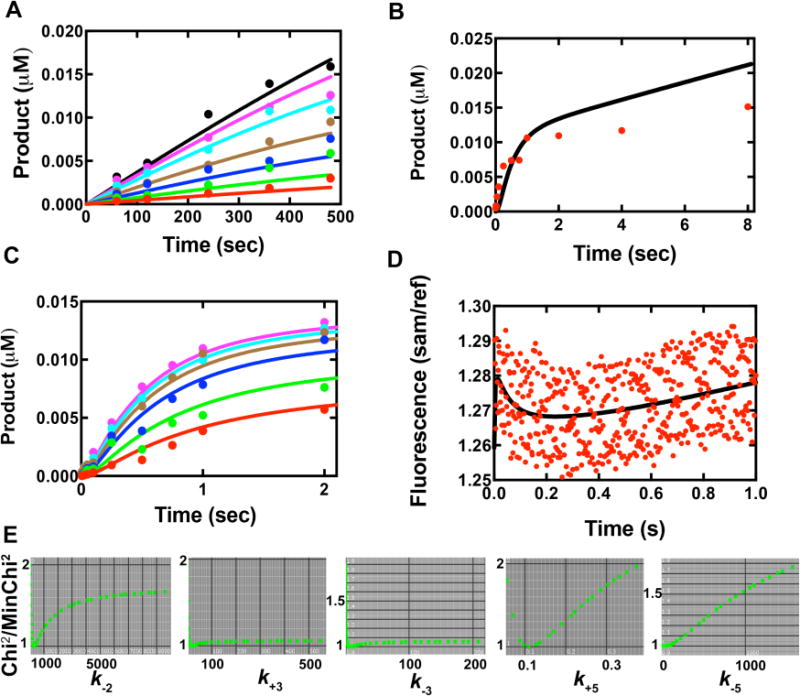
Fig. 9.

Global fit of multiple data sets to the simplified kinetic model in Scheme 2. Colored dots represent actual data and curves are from global fitting. (A) Steady-state kinetic results of Y50W inserting dCTP opposite template G. The concentrations of dCTP in different sets were 0.1 μM (red), 0.2 μM (green), 0.4 μM (blue), 0.8 μM (brown), 2 μM (cyan), 4 μM (purple) and 8 μM (black). (B) Pre-steady-state burst kinetics of Y50W under enzyme limiting conditions. The reaction contained 0.05 μM DNAG and 0.025 μM Y50W with 500 μM dCTP. (C) Concentration dependence of dCTP incorporation under single turnover conditions. Data were from rapid quench data, acquired using 0.025 μM DNA and 0.75 μM Y50W at varying dCTP concentrations, i.e. 0.5 μM (red), 1.0 μM (green), 2.5 μM (blue), 5.0 μM (brown), 10 μM (cyan), and 25 μM (purple). (D) Stopped-flow fluorescence changes of Y50W (1 μM) upon dCTP (10 μM) binding in the presence of 24-/36-mer duplex (1.05 μM). (E) 1-D FitSpace evaluation of kinetic simulation. Chi2 threshold limit 2; resolution of grid 20; parameter multiple minimum (lower bound) 0.0001; parameter multiple maximum (upper bound) 32.
