
Figure 3.


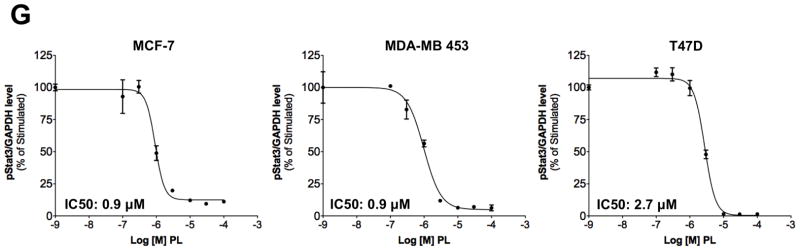
Piperlongumine inhibits constitutive and ligand-stimulated Stat3 activation in multiple breast cancer cell lines. Whole protein from MCF-10A, MCF-12A, MCF-7, T47D, ZR-75-1, BT-474, MDA-MB 453, Hs578T, HCC1954, MDA-MB-231, MDA-MB-468, and Sum159PT cells were assayed for pStat3/tStat3/GAPDH protein by Luminex. GAPDH-normalized pStat3 (± SD, A) and tStat3 (B) are shown along Y-axis. (C, D). Whole proteins from MDA-MB-231 (C) and MDA-MB-468 (D) cells, treated with PL (0/0.1/0.3/1/3/10/100 μM, 2.5 hrs) were assayed for pStat3/tStat3/GAPDH by Luminex. GAPDH-normalized pStat3 values were divided by that for untreated cells and expressed in percentage. These values were plotted as a function of Log [M] PL, and IC50 values calculated using GraphPad. Upper panel shows pStat3 data from representative experiments from each cell line. GAPDH-normalized total Stat3 from each treatment was similarly calculated and shown in the lower panel graphs. E. Whole proteins from MDA-MB-468 cells treated as in (D), were assayed for pStat1, pStat5, and total Stat1 and GAPDH. Upper panel (E) shows relative pStat1, pStat5 values and lower panel (E) shows total Stat1 values. F. Whole protein collected from MDA-MB-468 cells treated with 30 μM piperlongumine for indicated times were assayed for pStat3, total Stat3, and GAPDH using Luminex. GAPDH-normalized pStat3 (upper panel) or total Stat3 (lower panel) values (± SD) are shown along Y-axis. G. MCF7, MDA-MB-453 and T47D cells, were serum-starved (1hr), pre-treated with PL or DMSO (0/0.1/0.3/1/3/10/100 μM, 2hrs) and then stimulated with IL6/sIL6R (150ng/ml, 15′). Whole protein was extracted and pStat3, and GAPDH levels were determined by Luminex. GAPDH-normalized pStat3 values were divided by that for IL6/sIL6R-stimulated cells and expressed in percentage. These values were plotted as a function of Log [M] PL, and IC50 values calculated using GraphPad.