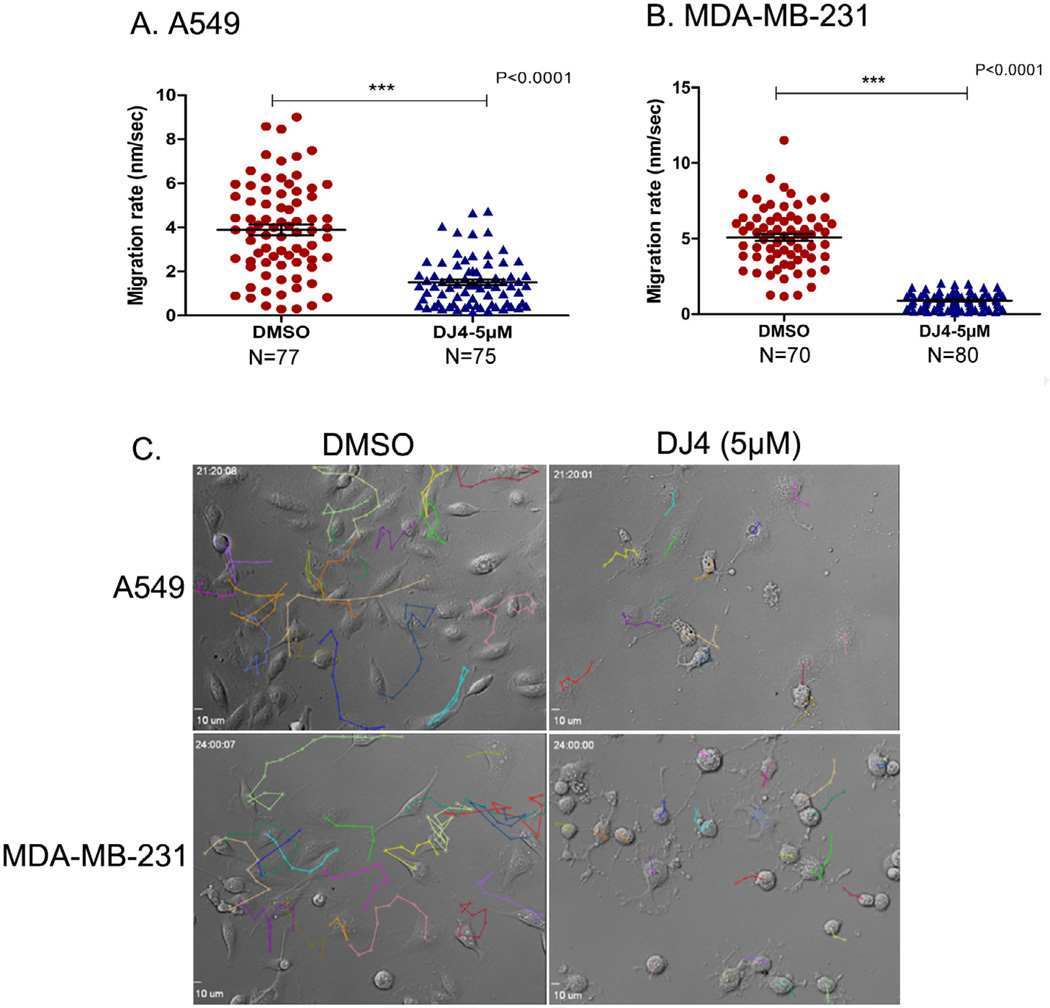
Fig. 6.
Single cell tracking of lung and breast cancer cells. (A and B) Scatter plots representing the migration rate of A549 cells (A) and MDA-MB-231 cells (B) (from four fields) treated with either DJ4 (5 µM) or DMSO (vehicle control). Error bars indicate SEM. (C) Individual cells from representative fields of A549 and MDA-MB-231 cells treated with either DMSO or DJ4 that were tracked to determine migration rate over a 21–24 h period.

