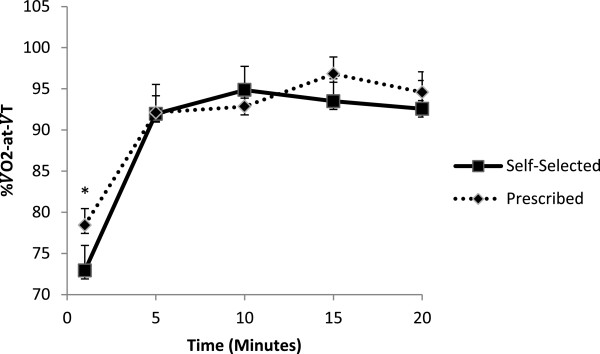
Figure 1.

across time for self-selected and prescribed exercise sessions. * = significantly lower than all other time points (p < .001), with standard error bars.

across time for self-selected and prescribed exercise sessions. * = significantly lower than all other time points (p < .001), with standard error bars.