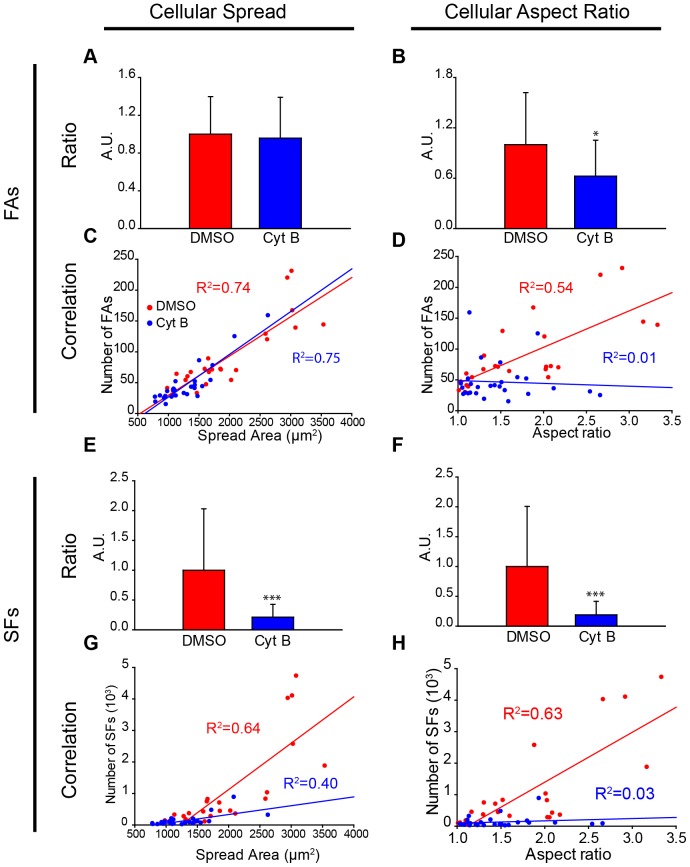
Figure 3. There are strong linear correlations between the number of SFs and FAs with cellular morphological features.
(A) Ratio between the number of FAs per cell divided by its spread area for both DMSO and CytB condition. DMSO control cells is normalized to one. The spread area of cells similarly defines the number of FAs in both conditions. (B) Same quantification taking into account the aspect ratio of cells. Differences between both cell types are statistically significant (*: p<0.05). (C) Corresponding correlation between the number of FAs of a cell and the spread area. (D) Likewise, same correlation analysis between FAs and the aspect ratio. (E–H) Same analysis performed with SFs instead of FAs. (E–F) Ratio between the number of SFs per cell and both cellular spread area and aspect ratio reveal that DMSO-treated cells have significantly more than CytB-treated cells (***: p<0.001) (D) (number of cells: DMSO, n = 24; Cyt B, n = 27). The trend line and the coefficient of determination can be observed for each condition.

