
Figure 2.
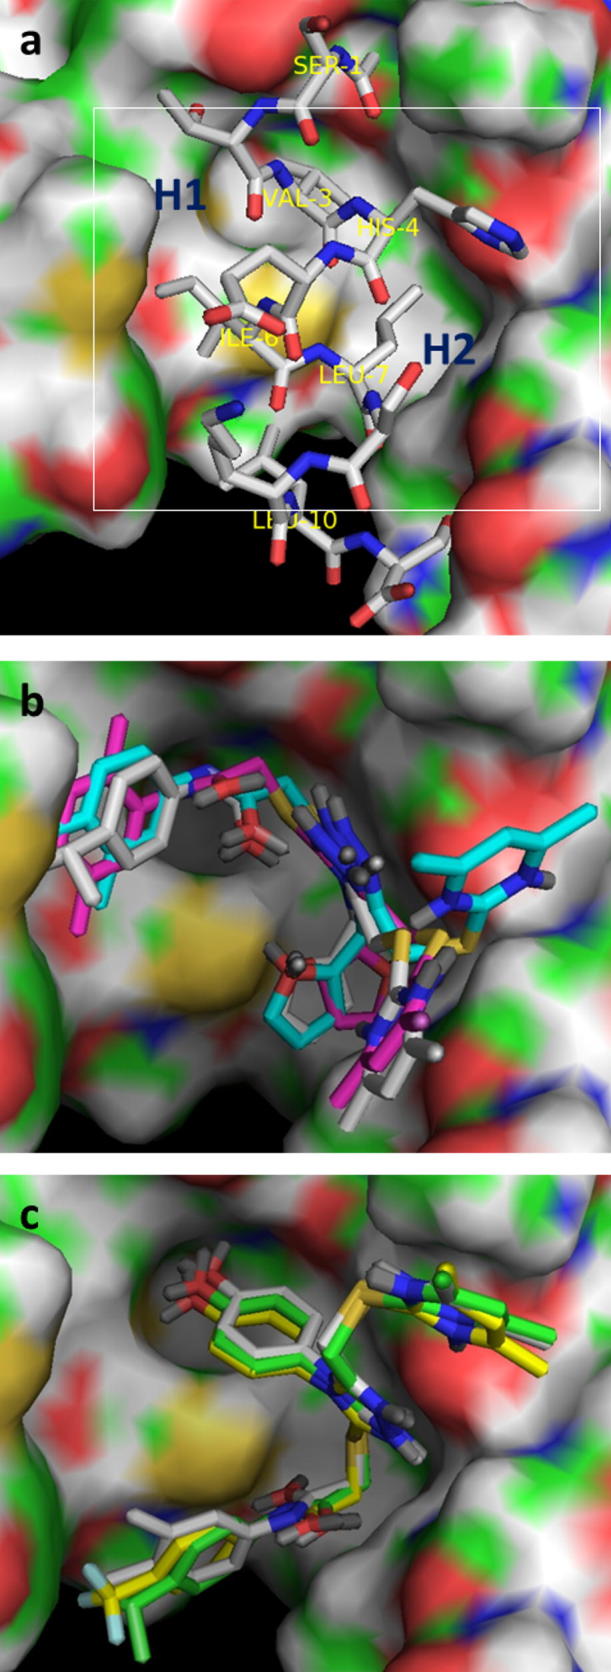
(a) Binding mode of the AnxA2 N-terminal peptide (represented as sticks; C: grey, N: blue, O: red) within the binding pocket on S100A10 (molecular surface C: green, N: blue, O: red, S: yellow, H: white). Hydrophobic regions of the binding pocket (H1 and H2) are shown. The white rectangle represents the area of the binding pocket used to visualise the docked poses in panels b and c. (b) Predicted binding modes of compounds 1a (C: magenta, N: dark blue, O: red, S: yellow, lone pairs: dark grey), 35 (C: light blue), and 36 (C: light grey). Hydrogens have been removed. (c) Predicted binding modes of compounds 48 (C: green), 52 (C: bright yellow, F: light blue), and 43 (C: light grey). Methyl moiety on OMe groups projects downwards and is obscured in the figure. Figure created in Pymol (DeLano).