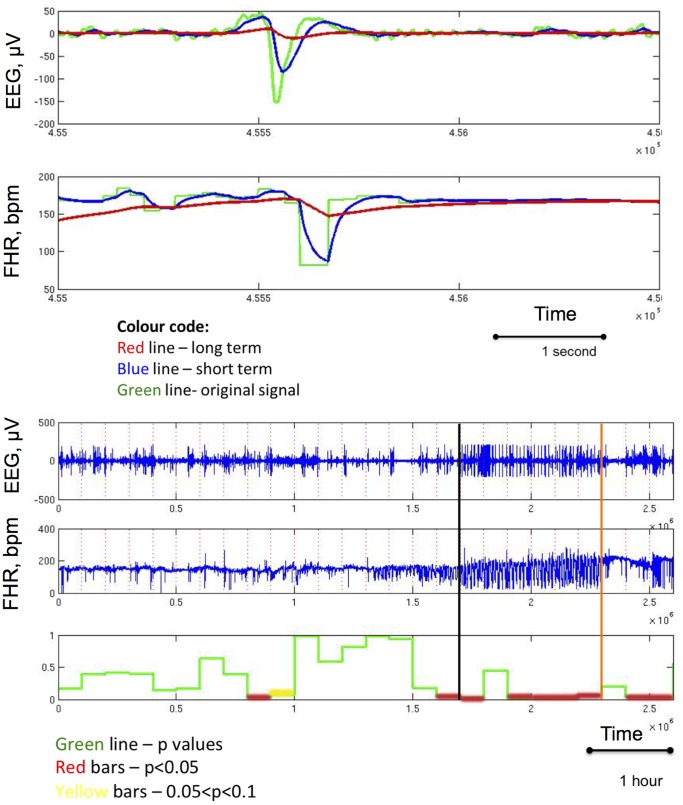
Figure 4. A representative example of crossing point detection.
TOP: Single change point and crossing point detection. BOTTOM: Complete experimental recording demonstrating detection of EEG-FHR synchronisation based on the crossing point detection and subsequent validation using logistic regression analysis. Vertical black line denotes onset of EEG-FHR synchronization as per visual expert analysis. Vertical orange bar denotes the drop of pH to less than 7.00. The p-values over time are rendered by red lines where the null hypothesis (no EEG-FHR synchronization) was rejected, i.e., p less than 5% and yellow lines where p value was between 5% and 10%. Note, that three subsequent crossing point detections are required to consider identifying EEG-FHR synchronization. This corresponds to a window length of 10 min (cf. Fig. 1).

